29
/es/
es
AIzaSyAYiBZKx7MnpbEhh9jyipgxe19OcubqV5w
April 1, 2024
262150
Thailand
THA
true
2
1
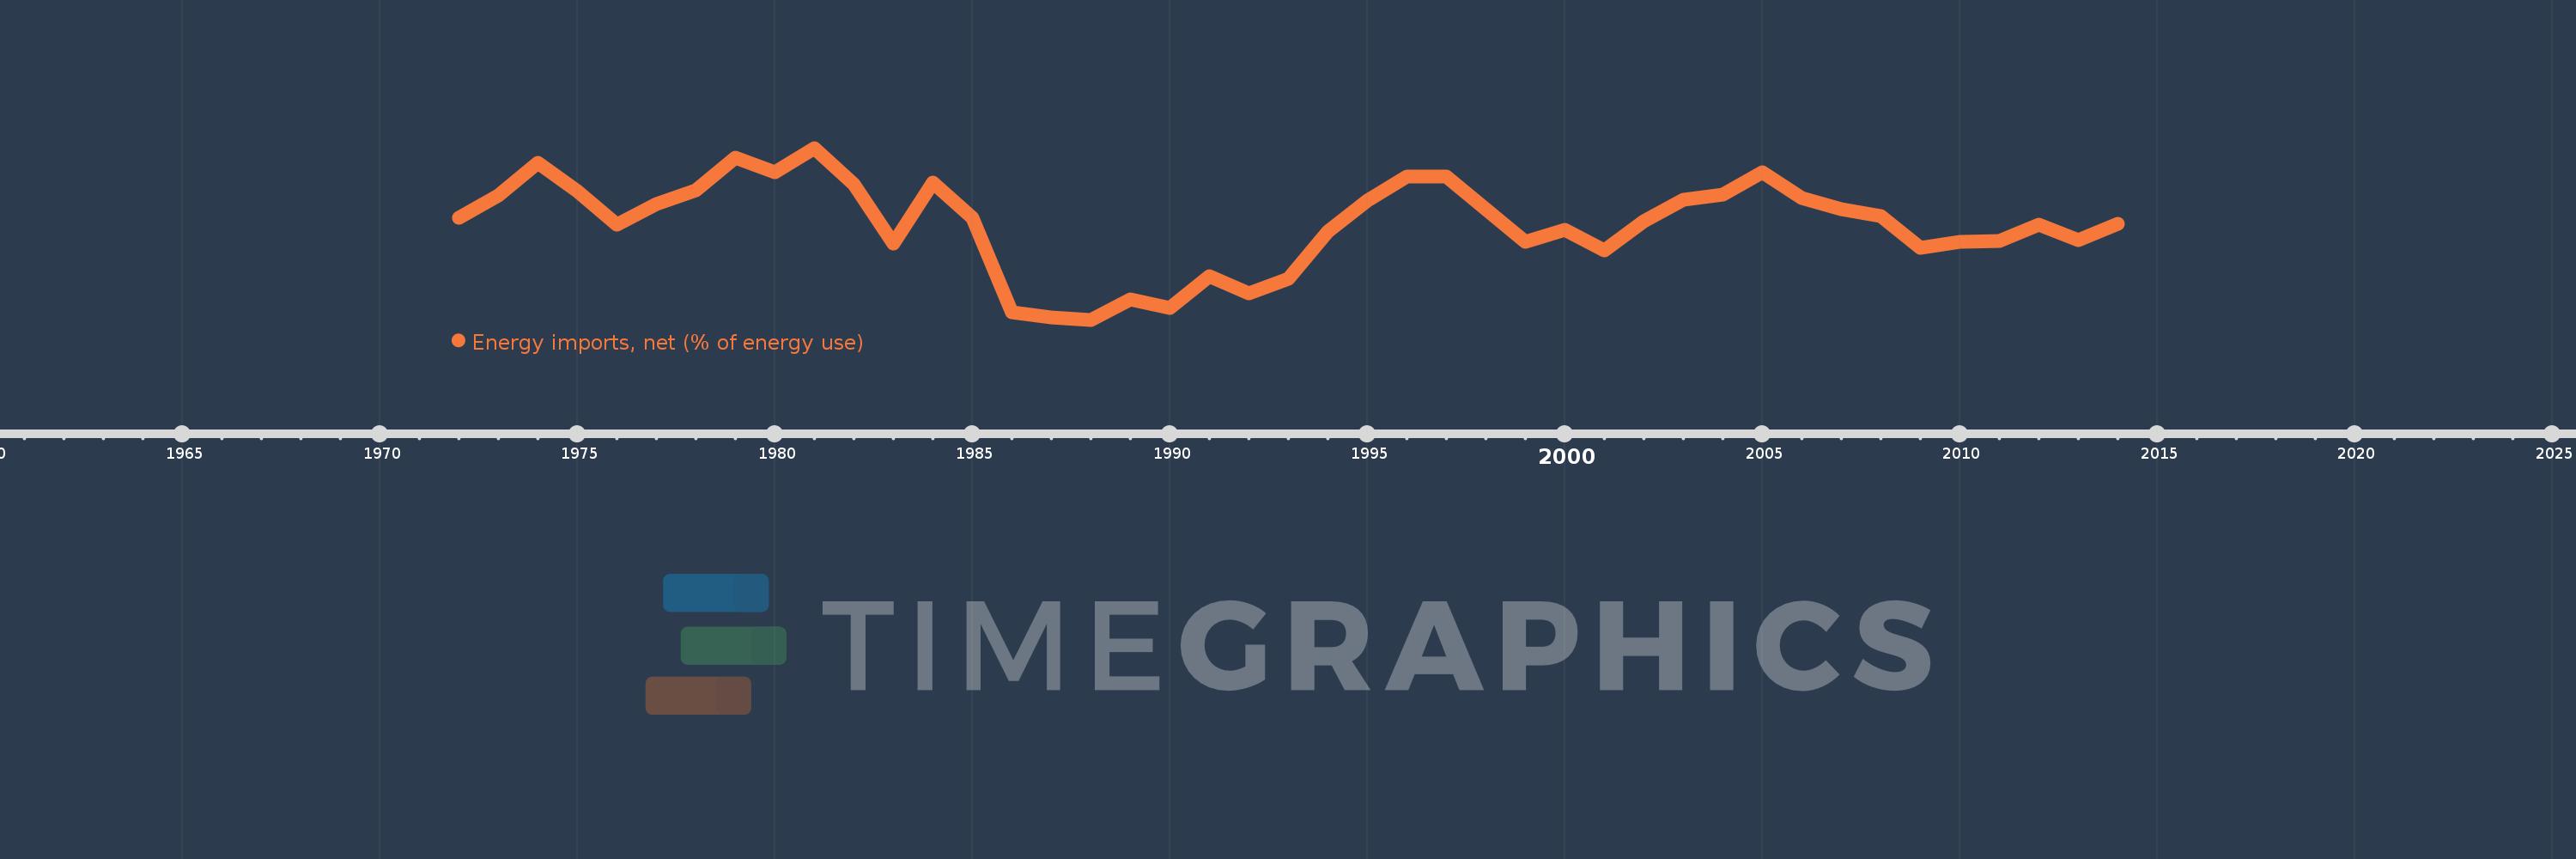
Energy imports, net (% of energy use)
2014,2013,2012,2011,2010,2009,2008,2007,2006,2005,2004,2003,2002,2001,2000,1999,1998,1997,1996,1995,1994,1993,1992,1991,1990,1989,1988,1987,1986,1985,1984,1983,1982,1981,1980,1979,1978,1977,1976,1975,1974,1973,1972
Estas estadísticas en otros países:
AlbaniaAlgeriaAngolaArab WorldArgentinaArmeniaAustraliaAustriaAzerbaijanBahrainBangladeshBelarusBelgiumBeninBoliviaBosnia and HerzegovinaBotswanaBrazilBrunei DarussalamBulgariaCambodiaCameroonCanadaCaribbean small statesCentral Europe and the BalticsChileChinaColombiaCongo, Dem. Rep.Congo, Rep.Costa RicaCote d'IvoireCroatiaCubaCuracaoCyprusCzech RepublicDenmarkDominican RepublicEarly-demographic dividendEast Asia & PacificEast Asia & Pacific (excluding high income)East Asia & Pacific (IDA & IBRD countries)EcuadorEgypt, Arab Rep.El SalvadorEritreaEstoniaEthiopiaEuro areaEurope & Central AsiaEurope & Central Asia (excluding high income)Europe & Central Asia (IDA & IBRD countries)European UnionFinlandFragile and conflict affected situationsFranceGabonGeorgiaGermanyGhanaGibraltarGreeceGuatemalaHaitiHeavily indebted poor countries (HIPC)High incomeHondurasHong Kong SAR, ChinaHungaryIBRD onlyIcelandIDA & IBRD totalIDA blendIDA onlyIDA totalIndiaIndonesiaIran, Islamic Rep.IraqIrelandIsraelItalyJamaicaJapanJordanKazakhstanKenyaKorea, Dem. People’s Rep.Korea, Rep.KosovoKuwaitKyrgyz RepublicLate-demographic dividendLatin America & Caribbean Latin America & Caribbean (excluding high income)Latin America & the Caribbean (IDA & IBRD countries)LatviaLeast developed countries: UN classificationLebanonLibyaLithuaniaLow & middle incomeLow incomeLower middle incomeLuxembourgMacedonia, FYRMalaysiaMaltaMauritiusMexicoMiddle East & North AfricaMiddle East & North Africa (excluding high income)Middle East & North Africa (IDA & IBRD countries)Middle incomeMoldovaMongoliaMontenegroMoroccoMozambiqueMyanmarNamibiaNepalNetherlandsNew ZealandNicaraguaNigerNigeriaNorth AmericaNorwayOECD membersOmanOther small statesPakistanPanamaParaguayPeruPhilippinesPolandPortugalPost-demographic dividendPre-demographic dividendQatarRomaniaRussian FederationSaudi ArabiaSenegalSerbiaSingaporeSlovak RepublicSloveniaSmall statesSouth AfricaSouth AsiaSouth Asia (IDA & IBRD)South SudanSpainSri LankaSub-Saharan Africa Sub-Saharan Africa (excluding high income)Sub-Saharan Africa (IDA & IBRD countries)SudanSwedenSwitzerlandSyrian Arab RepublicTajikistanTanzaniaThailandTogoTrinidad and TobagoTunisiaTurkeyTurkmenistanUkraineUnited Arab EmiratesUnited KingdomUnited StatesUpper middle incomeUruguayUzbekistanVenezuela, RBVietnamWorldYemen, Rep.ZambiaZimbabwe línea de tiempo (timeline):
En esta escala de tiempo se presenta un gráfico de 1972 y 2014 de Thailand. Los datos de 1971 están ausentes. El número de observaciones reales por fecha: 43.
Fuente (nombre):
Indicadores del desarrollo mundial
Fuente (organización):
IEA Statistics © OECD/IEA 2014 (http://www.iea.org/stats/index.asp), subject to https://www.iea.org/t&c/termsandconditions/
Categorías:
Energy & Mining, Trade
Se ha actualizado:
23 abr 2017 año
Los indicadores de los cambios de valor en los últimos años
Mínimo:
32.41
1 ene 1988 año
Máximo:
49.175
1 ene 1981 año
A la fecha de observación
Valor
Cambio absoluto
El cambio con respecto al valor anterior
1 ene 1972 año
42.343
+42.343
0.0%
1 ene 1973 año
44.549
+2.206
5.21%
1 ene 1974 año
47.697
+3.148
7.07%
1 ene 1975 año
44.948
-2.749
-5.76%
1 ene 1976 año
41.676
-3.273
-7.28%
1 ene 1977 año
43.686
+2.011
4.83%
1 ene 1978 año
45.057
+1.371
3.14%
1 ene 1979 año
48.192
+3.135
6.96%
1 ene 1980 año
46.769
-1.423
-2.95%
1 ene 1981 año
49.175
+2.406
5.15%
1 ene 1982 año
45.621
-3.554
-7.23%
1 ene 1983 año
39.876
-5.745
-12.59%
1 ene 1984 año
45.796
+5.92
14.85%
1 ene 1985 año
42.39
-3.406
-7.44%
1 ene 1986 año
33.098
-9.292
-21.92%
1 ene 1987 año
32.617
-0.481
-1.45%
1 ene 1988 año
32.41
-0.208
-0.64%
1 ene 1989 año
34.388
+1.978
6.1%
1 ene 1990 año
33.559
-0.828
-2.41%
1 ene 1991 año
36.64
+3.081
9.18%
1 ene 1992 año
34.968
-1.672
-4.56%
1 ene 1993 año
36.421
+1.453
4.16%
1 ene 1994 año
41.001
+4.58
12.57%
1 ene 1995 año
44.034
+3.033
7.4%
1 ene 1996 año
46.397
+2.363
5.37%
1 ene 1997 año
46.346
-0.051
-0.11%
1 ene 1998 año
43.239
-3.107
-6.7%
1 ene 1999 año
39.98
-3.259
-7.54%
1 ene 2000 año
41.161
+1.181
2.95%
1 ene 2001 año
39.202
-1.959
-4.76%
1 ene 2002 año
42.032
+2.829
7.22%
1 ene 2003 año
44.112
+2.081
4.95%
1 ene 2004 año
44.653
+0.541
1.23%
1 ene 2005 año
46.761
+2.108
4.72%
1 ene 2006 año
44.257
-2.504
-5.35%
1 ene 2007 año
43.201
-1.056
-2.39%
1 ene 2008 año
42.521
-0.68
-1.57%
1 ene 2009 año
39.407
-3.114
-7.32%
1 ene 2010 año
39.998
+0.591
1.5%
1 ene 2011 año
40.107
+0.109
0.27%
1 ene 2012 año
41.654
+1.547
3.86%
1 ene 2013 año
40.215
-1.439
-3.46%
1 ene 2014 año
41.765
+1.55
3.85%
Ranking de los países por los datos estadísticos actuales


Comentarios: