29
/es/
es
AIzaSyAYiBZKx7MnpbEhh9jyipgxe19OcubqV5w
April 1, 2024
41083
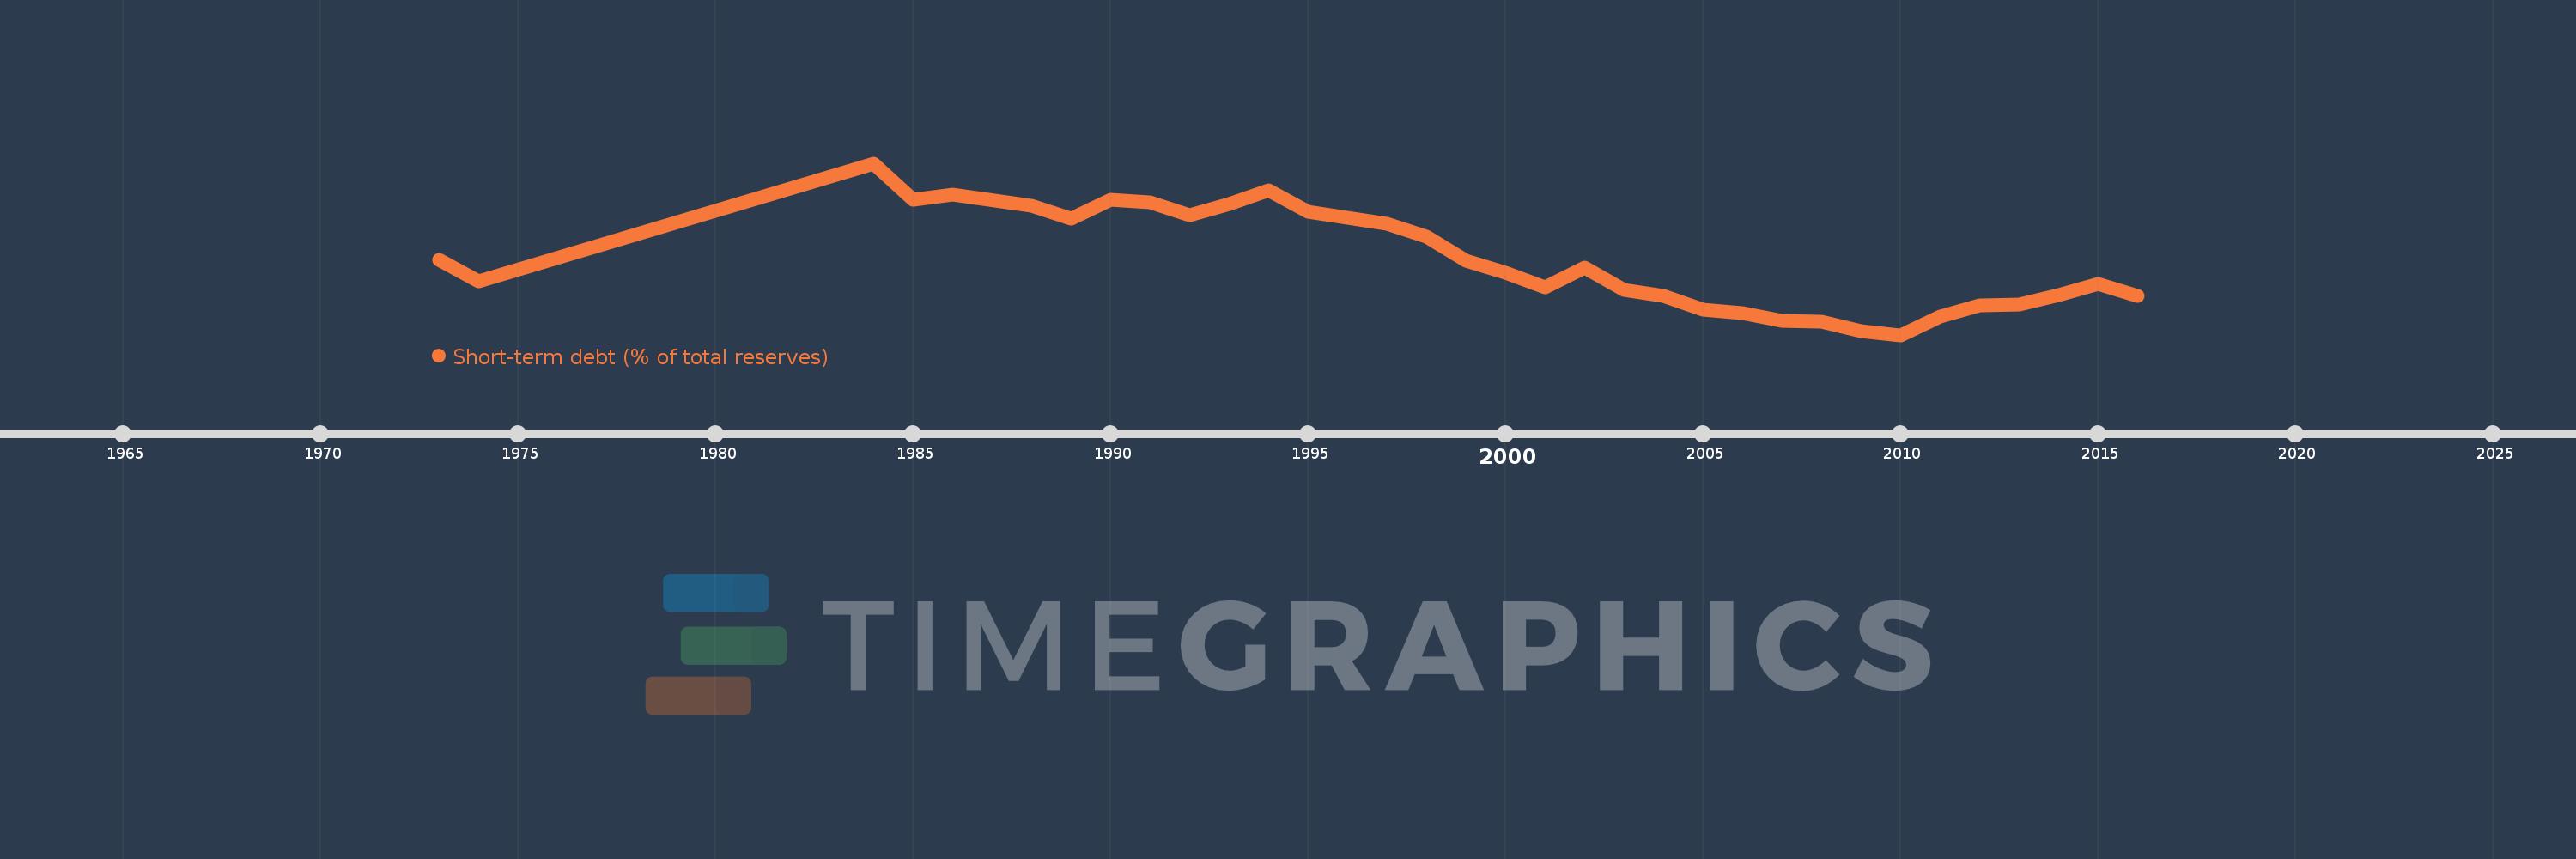
Late-demographic dividend
LTE
false
2
1
Short-term debt (% of total reserves)
2016,2015,2014,2013,2012,2011,2010,2009,2008,2007,2006,2005,2004,2003,2002,2001,2000,1999,1998,1997,1996,1995,1994,1993,1992,1991,1990,1989,1988,1986,1985,1984,1974,1973
Estas estadísticas en otros países:
línea de tiempo (timeline):
En esta escala de tiempo se presenta un gráfico de 1973 y 2016 de Late-demographic dividend. Los datos de 1972 están ausentes. El número de observaciones reales por fecha: 34.
Fuente (nombre):
Indicadores del desarrollo mundial
Fuente (organización):
World Bank, International Debt Statistics.
Categorías:
Economy & Growth, External Debt
Se ha actualizado:
23 abr 2017 año
Los indicadores de los cambios de valor en los últimos años
Mínimo:
13.105
1 ene 2010 año
Máximo:
71.501
1 ene 1984 año
A la fecha de observación
Valor
Cambio absoluto
El cambio con respecto al valor anterior
1 ene 1973 año
38.591
+38.591
0.0%
1 ene 1974 año
31.261
-7.33
-18.99%
1 ene 1984 año
71.501
+40.24
128.72%
1 ene 1985 año
59.002
-12.498
-17.48%
1 ene 1986 año
60.956
+1.953
3.31%
1 ene 1988 año
56.97
-3.985
-6.54%
1 ene 1989 año
52.735
-4.235
-7.43%
1 ene 1990 año
58.966
+6.231
11.81%
1 ene 1991 año
58.343
-0.623
-1.06%
1 ene 1992 año
53.803
-4.539
-7.78%
1 ene 1993 año
57.616
+3.813
7.09%
1 ene 1994 año
62.388
+4.772
8.28%
1 ene 1995 año
55.009
-7.379
-11.83%
1 ene 1996 año
53.092
-1.917
-3.48%
1 ene 1997 año
51.056
-2.036
-3.83%
1 ene 1998 año
46.536
-4.521
-8.85%
1 ene 1999 año
38.445
-8.091
-17.39%
1 ene 2000 año
34.352
-4.092
-10.64%
1 ene 2001 año
29.268
-5.084
-14.8%
1 ene 2002 año
36.169
+6.901
23.58%
1 ene 2003 año
28.387
-7.782
-21.52%
1 ene 2004 año
26.382
-2.005
-7.06%
1 ene 2005 año
21.684
-4.698
-17.81%
1 ene 2006 año
20.495
-1.189
-5.48%
1 ene 2007 año
17.918
-2.577
-12.57%
1 ene 2008 año
17.748
-0.17
-0.95%
1 ene 2009 año
14.39
-3.358
-18.92%
1 ene 2010 año
13.105
-1.285
-8.93%
1 ene 2011 año
19.244
+6.139
46.84%
1 ene 2012 año
23.044
+3.799
19.74%
1 ene 2013 año
23.396
+0.352
1.53%
1 ene 2014 año
26.76
+3.364
14.38%
1 ene 2015 año
30.461
+3.701
13.83%
1 ene 2016 año
26.333
-4.128
-13.55%
Ranking de los países por los datos estadísticos actuales


Comentarios: