29
/es/
es
AIzaSyAYiBZKx7MnpbEhh9jyipgxe19OcubqV5w
April 1, 2024
145115
Guatemala
GTM
true
2
1
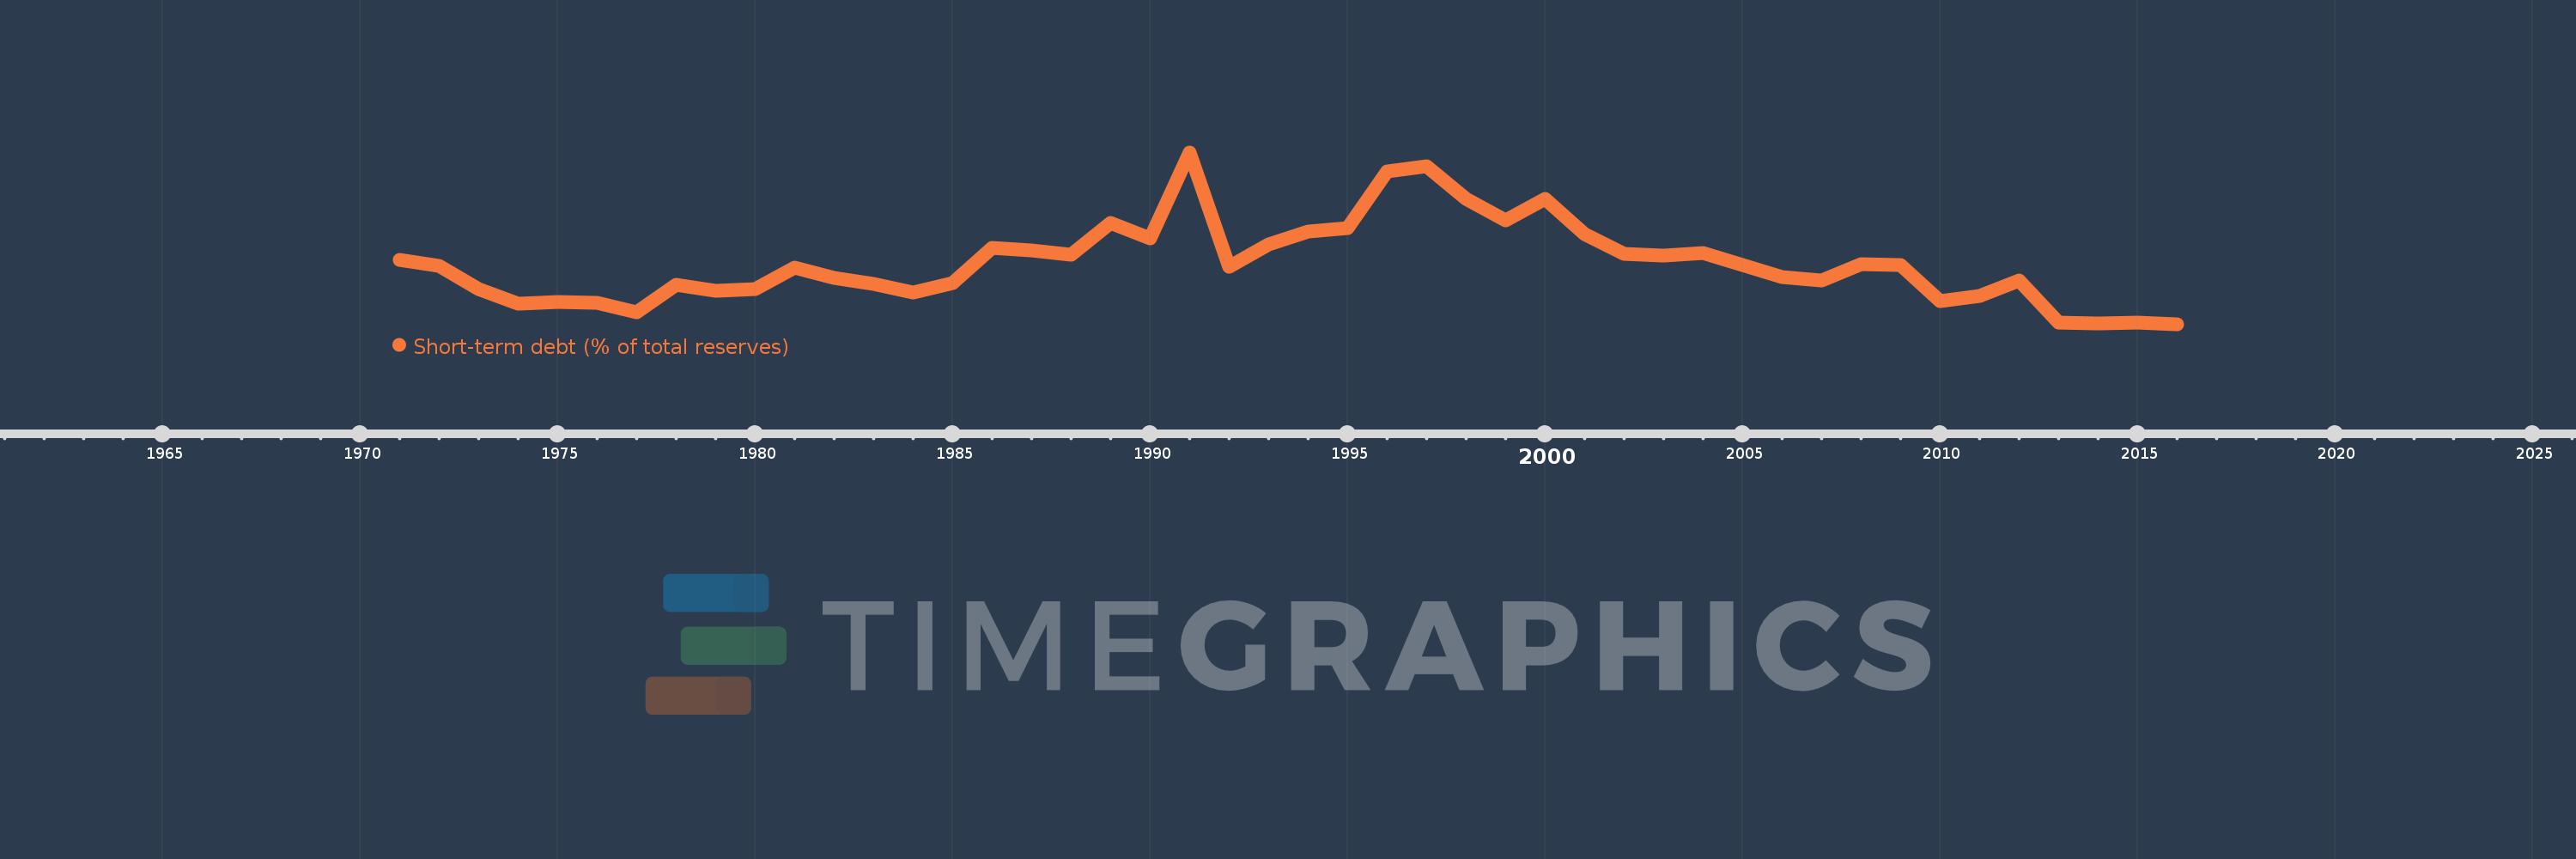
Short-term debt (% of total reserves)
2016,2015,2014,2013,2012,2011,2010,2009,2008,2007,2006,2005,2004,2003,2002,2001,2000,1999,1998,1997,1996,1995,1994,1993,1992,1991,1990,1989,1988,1987,1986,1985,1984,1983,1982,1981,1980,1979,1978,1977,1976,1975,1974,1973,1972,1971
Estas estadísticas en otros países:
línea de tiempo (timeline):
En esta escala de tiempo se presenta un gráfico de 1971 y 2016 de Guatemala. Los datos de 1970 están ausentes. El número de observaciones reales por fecha: 46.
Fuente (nombre):
Indicadores del desarrollo mundial
Fuente (organización):
World Bank, International Debt Statistics.
Categorías:
Economy & Growth, External Debt
Se ha actualizado:
23 abr 2017 año
Los indicadores de los cambios de valor en los últimos años
Mínimo:
9.422
1 ene 2016 año
Máximo:
115.537
1 ene 1991 año
A la fecha de observación
Valor
Cambio absoluto
El cambio con respecto al valor anterior
1 ene 1971 año
49.093
+49.093
0.0%
1 ene 1972 año
45.707
-3.386
-6.9%
1 ene 1973 año
31.051
-14.656
-32.06%
1 ene 1974 año
21.909
-9.142
-29.44%
1 ene 1975 año
23.082
+1.173
5.36%
1 ene 1976 año
22.4
-0.682
-2.96%
1 ene 1977 año
16.868
-5.531
-24.69%
1 ene 1978 año
33.888
+17.02
100.9%
1 ene 1979 año
30.193
-3.694
-10.9%
1 ene 1980 año
31.234
+1.04
3.45%
1 ene 1981 año
44.513
+13.28
42.52%
1 ene 1982 año
38.172
-6.341
-14.25%
1 ene 1983 año
34.115
-4.057
-10.63%
1 ene 1984 año
29.124
-4.991
-14.63%
1 ene 1985 año
34.843
+5.719
19.64%
1 ene 1986 año
56.518
+21.675
62.21%
1 ene 1987 año
55.149
-1.369
-2.42%
1 ene 1988 año
52.564
-2.585
-4.69%
1 ene 1989 año
72.164
+19.599
37.29%
1 ene 1990 año
62.532
-9.631
-13.35%
1 ene 1991 año
115.537
+53.004
84.76%
1 ene 1992 año
44.888
-70.649
-61.15%
1 ene 1993 año
58.859
+13.971
31.12%
1 ene 1994 año
66.763
+7.904
13.43%
1 ene 1995 año
68.901
+2.139
3.2%
1 ene 1996 año
103.673
+34.772
50.47%
1 ene 1997 año
107.243
+3.57
3.44%
1 ene 1998 año
86.914
-20.329
-18.96%
1 ene 1999 año
73.683
-13.231
-15.22%
1 ene 2000 año
86.863
+13.18
17.89%
1 ene 2001 año
64.908
-21.956
-25.28%
1 ene 2002 año
52.672
-12.236
-18.85%
1 ene 2003 año
51.934
-0.738
-1.4%
1 ene 2004 año
53.666
+1.732
3.34%
1 ene 2005 año
45.878
-7.788
-14.51%
1 ene 2006 año
38.468
-7.41
-16.15%
1 ene 2007 año
36.348
-2.12
-5.51%
1 ene 2008 año
46.448
+10.1
27.79%
1 ene 2009 año
46.219
-0.229
-0.49%
1 ene 2010 año
23.555
-22.664
-49.04%
1 ene 2011 año
26.645
+3.09
13.12%
1 ene 2012 año
36.685
+10.04
37.68%
1 ene 2013 año
10.377
-26.308
-71.71%
1 ene 2014 año
9.822
-0.555
-5.34%
1 ene 2015 año
10.371
+0.549
5.59%
1 ene 2016 año
9.422
-0.949
-9.15%
Ranking de los países por los datos estadísticos actuales


Comentarios: