29
/es/
es
AIzaSyAYiBZKx7MnpbEhh9jyipgxe19OcubqV5w
April 1, 2024
265300
Togo
TGO
true
2
1
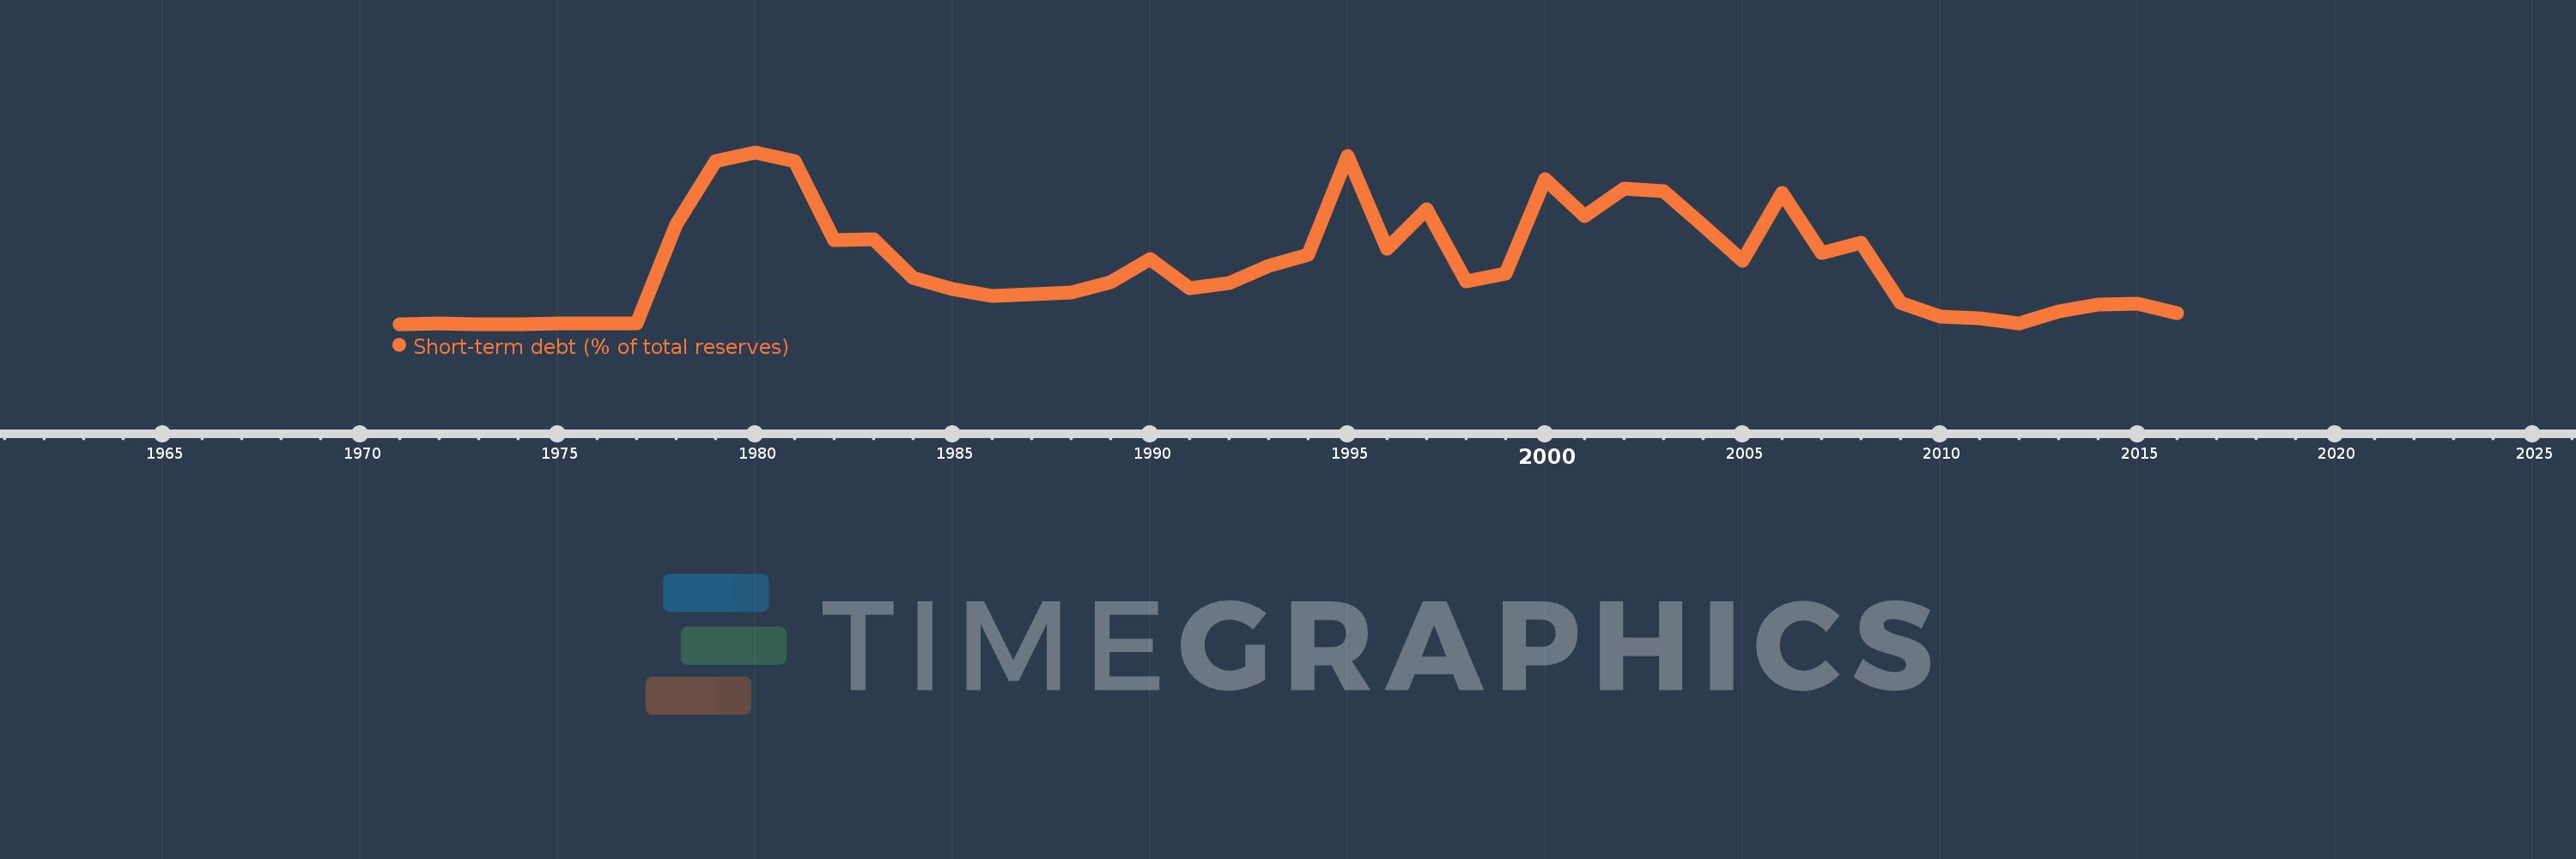
Short-term debt (% of total reserves)
2016,2015,2014,2013,2012,2011,2010,2009,2008,2007,2006,2005,2004,2003,2002,2001,2000,1999,1998,1997,1996,1995,1994,1993,1992,1991,1990,1989,1988,1987,1986,1985,1984,1983,1982,1981,1980,1979,1978,1977,1976,1975,1974,1973,1972,1971
Estas estadísticas en otros países:
línea de tiempo (timeline):
En esta escala de tiempo se presenta un gráfico de 1971 y 2016 de Togo. Los datos de 1970 están ausentes. El número de observaciones reales por fecha: 46.
Fuente (nombre):
Indicadores del desarrollo mundial
Fuente (organización):
World Bank, International Debt Statistics.
Categorías:
Economy & Growth, External Debt
Se ha actualizado:
23 abr 2017 año
Los indicadores de los cambios de valor en los últimos años
Mínimo:
0.005
1 ene 1973 año
Máximo:
148.912
1 ene 1980 año
A la fecha de observación
Valor
Cambio absoluto
El cambio con respecto al valor anterior
1 ene 1971 año
0.11
+0.11
0.0%
1 ene 1972 año
0.965
+0.855
774.68%
1 ene 1973 año
0.005
-0.96
-99.43%
1 ene 1974 año
0.153
+0.147
2.69 mil%
1 ene 1975 año
0.516
+0.363
237.41%
1 ene 1976 año
0.352
-0.164
-31.78%
1 ene 1977 año
0.722
+0.37
105.09%
1 ene 1978 año
86.012
+85.29
11.81 mil%
1 ene 1979 año
141.753
+55.741
64.81%
1 ene 1980 año
148.912
+7.159
5.05%
1 ene 1981 año
141.557
-7.355
-4.94%
1 ene 1982 año
72.792
-68.764
-48.58%
1 ene 1983 año
73.297
+0.505
0.69%
1 ene 1984 año
40.184
-33.113
-45.18%
1 ene 1985 año
30.415
-9.77
-24.31%
1 ene 1986 año
24.609
-5.806
-19.09%
1 ene 1987 año
25.705
+1.096
4.45%
1 ene 1988 año
27.572
+1.867
7.26%
1 ene 1989 año
36.384
+8.812
31.96%
1 ene 1990 año
56.376
+19.992
54.95%
1 ene 1991 año
31.549
-24.827
-44.04%
1 ene 1992 año
35.897
+4.348
13.78%
1 ene 1993 año
50.831
+14.934
41.6%
1 ene 1994 año
60.348
+9.517
18.72%
1 ene 1995 año
145.851
+85.503
141.68%
1 ene 1996 año
65.093
-80.758
-55.37%
1 ene 1997 año
99.392
+34.299
52.69%
1 ene 1998 año
37.085
-62.307
-62.69%
1 ene 1999 año
44.013
+6.928
18.68%
1 ene 2000 año
126.009
+81.996
186.3%
1 ene 2001 año
94.08
-31.929
-25.34%
1 ene 2002 año
117.612
+23.532
25.01%
1 ene 2003 año
115.702
-1.91
-1.62%
1 ene 2004 año
85.9
-29.802
-25.76%
1 ene 2005 año
54.748
-31.152
-36.27%
1 ene 2006 año
113.681
+58.933
107.64%
1 ene 2007 año
61.855
-51.826
-45.59%
1 ene 2008 año
70.831
+8.976
14.51%
1 ene 2009 año
18.535
-52.297
-73.83%
1 ene 2010 año
6.68
-11.855
-63.96%
1 ene 2011 año
5.442
-1.237
-18.52%
1 ene 2012 año
0.749
-4.693
-86.23%
1 ene 2013 año
11.231
+10.481
1.4 mil%
1 ene 2014 año
17.141
+5.91
52.62%
1 ene 2015 año
17.604
+0.463
2.7%
1 ene 2016 año
9.418
-8.186
-46.5%
Ranking de los países por los datos estadísticos actuales


Comentarios: