29
/es/
es
AIzaSyAYiBZKx7MnpbEhh9jyipgxe19OcubqV5w
April 1, 2024
124226
Ecuador
ECU
true
2
1
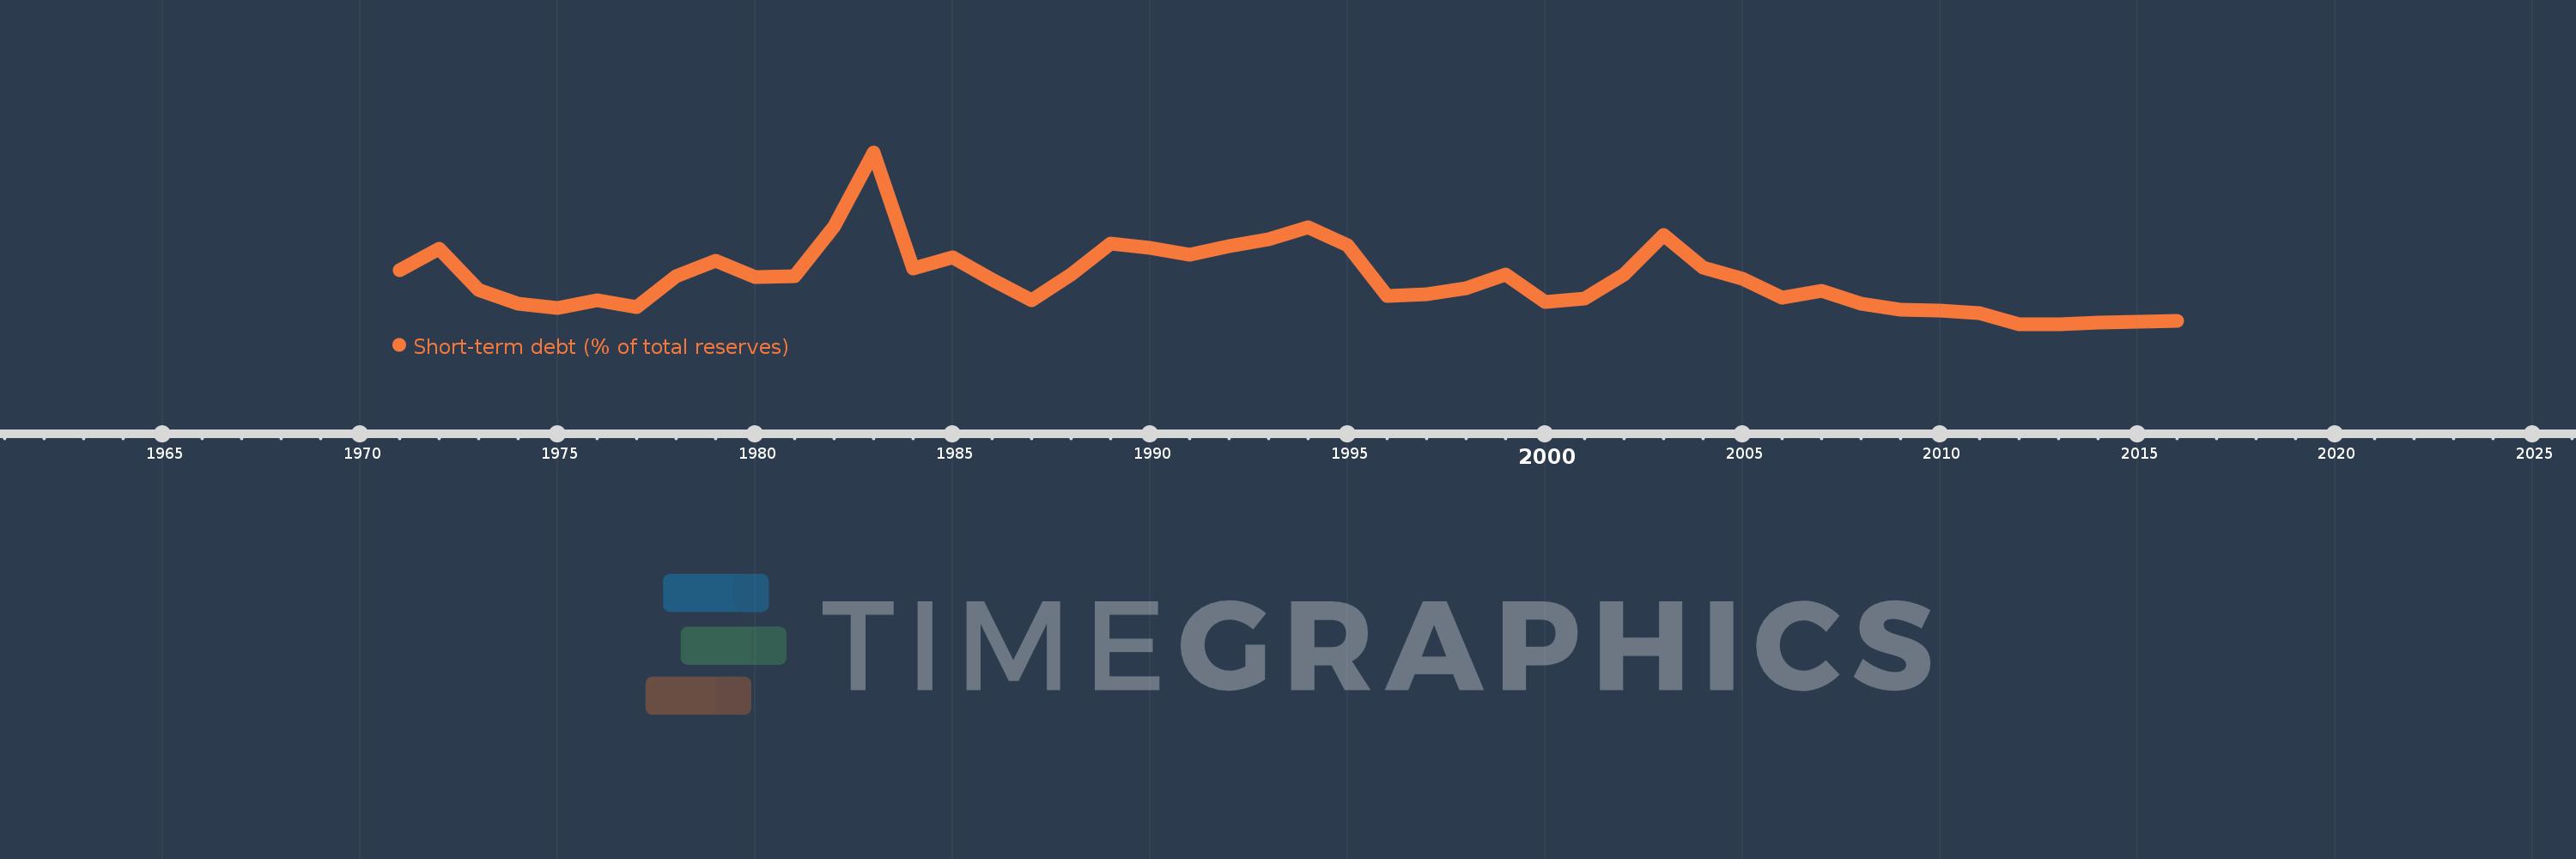
Short-term debt (% of total reserves)
2016,2015,2014,2013,2012,2011,2010,2009,2008,2007,2006,2005,2004,2003,2002,2001,2000,1999,1998,1997,1996,1995,1994,1993,1992,1991,1990,1989,1988,1987,1986,1985,1984,1983,1982,1981,1980,1979,1978,1977,1976,1975,1974,1973,1972,1971
Estas estadísticas en otros países:
línea de tiempo (timeline):
En esta escala de tiempo se presenta un gráfico de 1971 y 2016 de Ecuador. Los datos de 1970 están ausentes. El número de observaciones reales por fecha: 46.
Fuente (nombre):
Indicadores del desarrollo mundial
Fuente (organización):
World Bank, International Debt Statistics.
Categorías:
Economy & Growth, External Debt
Se ha actualizado:
23 abr 2017 año
Los indicadores de los cambios de valor en los últimos años
Mínimo:
1.68
1 ene 2012 año
Máximo:
444.017
1 ene 1983 año
A la fecha de observación
Valor
Cambio absoluto
El cambio con respecto al valor anterior
1 ene 1971 año
140.197
+140.197
0.0%
1 ene 1972 año
197.052
+56.854
40.55%
1 ene 1973 año
90.422
-106.629
-54.11%
1 ene 1974 año
54.788
-35.635
-39.41%
1 ene 1975 año
43.519
-11.268
-20.57%
1 ene 1976 año
64.392
+20.872
47.96%
1 ene 1977 año
45.335
-19.057
-29.59%
1 ene 1978 año
124.226
+78.891
174.02%
1 ene 1979 año
164.61
+40.383
32.51%
1 ene 1980 año
123.006
-41.603
-25.27%
1 ene 1981 año
125.285
+2.278
1.85%
1 ene 1982 año
253.564
+128.279
102.39%
1 ene 1983 año
444.017
+190.453
75.11%
1 ene 1984 año
145.294
-298.723
-67.28%
1 ene 1985 año
173.916
+28.622
19.7%
1 ene 1986 año
115.894
-58.021
-33.36%
1 ene 1987 año
62.43
-53.464
-46.13%
1 ene 1988 año
129.341
+66.911
107.18%
1 ene 1989 año
210.259
+80.918
62.56%
1 ene 1990 año
199.174
-11.085
-5.27%
1 ene 1991 año
179.768
-19.406
-9.74%
1 ene 1992 año
202.803
+23.036
12.81%
1 ene 1993 año
221.347
+18.544
9.14%
1 ene 1994 año
250.618
+29.27
13.22%
1 ene 1995 año
204.717
-45.901
-18.32%
1 ene 1996 año
73.391
-131.326
-64.15%
1 ene 1997 año
78.867
+5.476
7.46%
1 ene 1998 año
93.487
+14.62
18.54%
1 ene 1999 año
130.625
+37.138
39.73%
1 ene 2000 año
59.888
-70.737
-54.15%
1 ene 2001 año
67.608
+7.72
12.89%
1 ene 2002 año
128.89
+61.282
90.64%
1 ene 2003 año
230.43
+101.54
78.78%
1 ene 2004 año
147.135
-83.295
-36.15%
1 ene 2005 año
119.736
-27.399
-18.62%
1 ene 2006 año
70.781
-48.955
-40.89%
1 ene 2007 año
87.445
+16.665
23.54%
1 ene 2008 año
53.809
-33.636
-38.47%
1 ene 2009 año
39.064
-14.746
-27.4%
1 ene 2010 año
36.805
-2.259
-5.78%
1 ene 2011 año
30.442
-6.363
-17.29%
1 ene 2012 año
1.68
-28.761
-94.48%
1 ene 2013 año
1.938
+0.258
15.35%
1 ene 2014 año
6.596
+4.657
240.29%
1 ene 2015 año
7.334
+0.739
11.2%
1 ene 2016 año
11.034
+3.7
50.44%
Ranking de los países por los datos estadísticos actuales


Comentarios: