29
/es/
es
AIzaSyAYiBZKx7MnpbEhh9jyipgxe19OcubqV5w
April 1, 2024
203631
Mozambique
MOZ
true
2
1
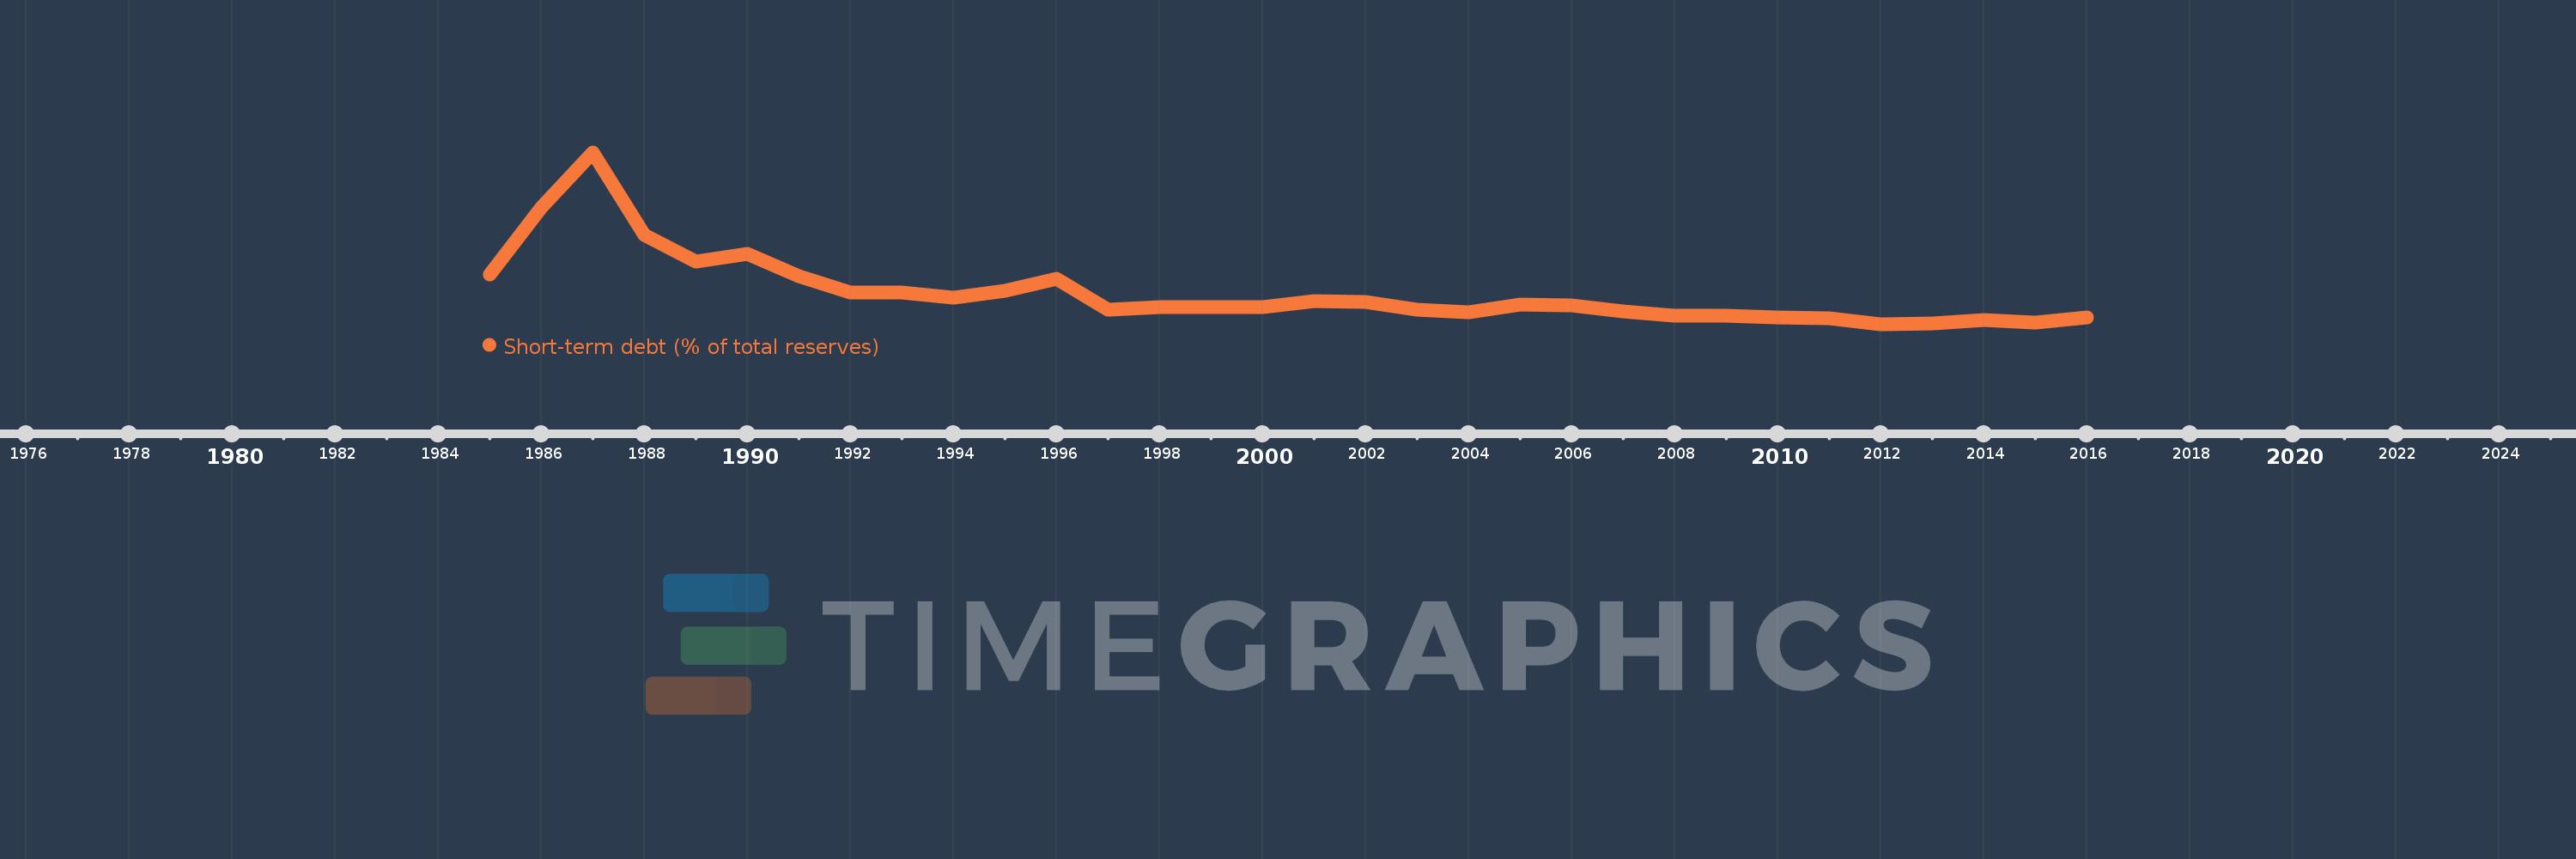
Short-term debt (% of total reserves)
2016,2015,2014,2013,2012,2011,2010,2009,2008,2007,2006,2005,2004,2003,2002,2001,2000,1999,1998,1997,1996,1995,1994,1993,1992,1991,1990,1989,1988,1987,1986,1985
Estas estadísticas en otros países:
línea de tiempo (timeline):
En esta escala de tiempo se presenta un gráfico de 1985 y 2016 de Mozambique. Los datos de 1984 están ausentes. El número de observaciones reales por fecha: 32.
Fuente (nombre):
Indicadores del desarrollo mundial
Fuente (organización):
World Bank, International Debt Statistics.
Categorías:
Economy & Growth, External Debt
Se ha actualizado:
23 abr 2017 año
Los indicadores de los cambios de valor en los últimos años
Mínimo:
10.115
1 ene 2012 año
Máximo:
504.401
1 ene 1987 año
A la fecha de observación
Valor
Cambio absoluto
El cambio con respecto al valor anterior
1 ene 1985 año
152.159
+152.159
0.0%
1 ene 1986 año
344.779
+192.619
126.59%
1 ene 1987 año
504.401
+159.622
46.3%
1 ene 1988 año
265.883
-238.518
-47.29%
1 ene 1989 año
191.088
-74.794
-28.13%
1 ene 1990 año
213.044
+21.956
11.49%
1 ene 1991 año
148.369
-64.676
-30.36%
1 ene 1992 año
102.117
-46.251
-31.17%
1 ene 1993 año
101.26
-0.857
-0.84%
1 ene 1994 año
86.582
-14.678
-14.5%
1 ene 1995 año
105.441
+18.858
21.78%
1 ene 1996 año
142.0
+36.56
34.67%
1 ene 1997 año
52.49
-89.51
-63.04%
1 ene 1998 año
59.169
+6.68
12.73%
1 ene 1999 año
58.124
-1.045
-1.77%
1 ene 2000 año
59.441
+1.316
2.26%
1 ene 2001 año
75.388
+15.947
26.83%
1 ene 2002 año
74.897
-0.491
-0.65%
1 ene 2003 año
52.445
-22.452
-29.98%
1 ene 2004 año
44.888
-7.557
-14.41%
1 ene 2005 año
67.668
+22.78
50.75%
1 ene 2006 año
64.759
-2.909
-4.3%
1 ene 2007 año
47.498
-17.26
-26.65%
1 ene 2008 año
33.854
-13.645
-28.73%
1 ene 2009 año
34.951
+1.098
3.24%
1 ene 2010 año
28.98
-5.972
-17.09%
1 ene 2011 año
26.639
-2.341
-8.08%
1 ene 2012 año
10.115
-16.524
-62.03%
1 ene 2013 año
11.628
+1.513
14.95%
1 ene 2014 año
21.444
+9.816
84.42%
1 ene 2015 año
13.596
-7.848
-36.6%
1 ene 2016 año
29.193
+15.596
114.71%
Ranking de los países por los datos estadísticos actuales


Comentarios: