29
/es/
es
AIzaSyAYiBZKx7MnpbEhh9jyipgxe19OcubqV5w
April 1, 2024
35457
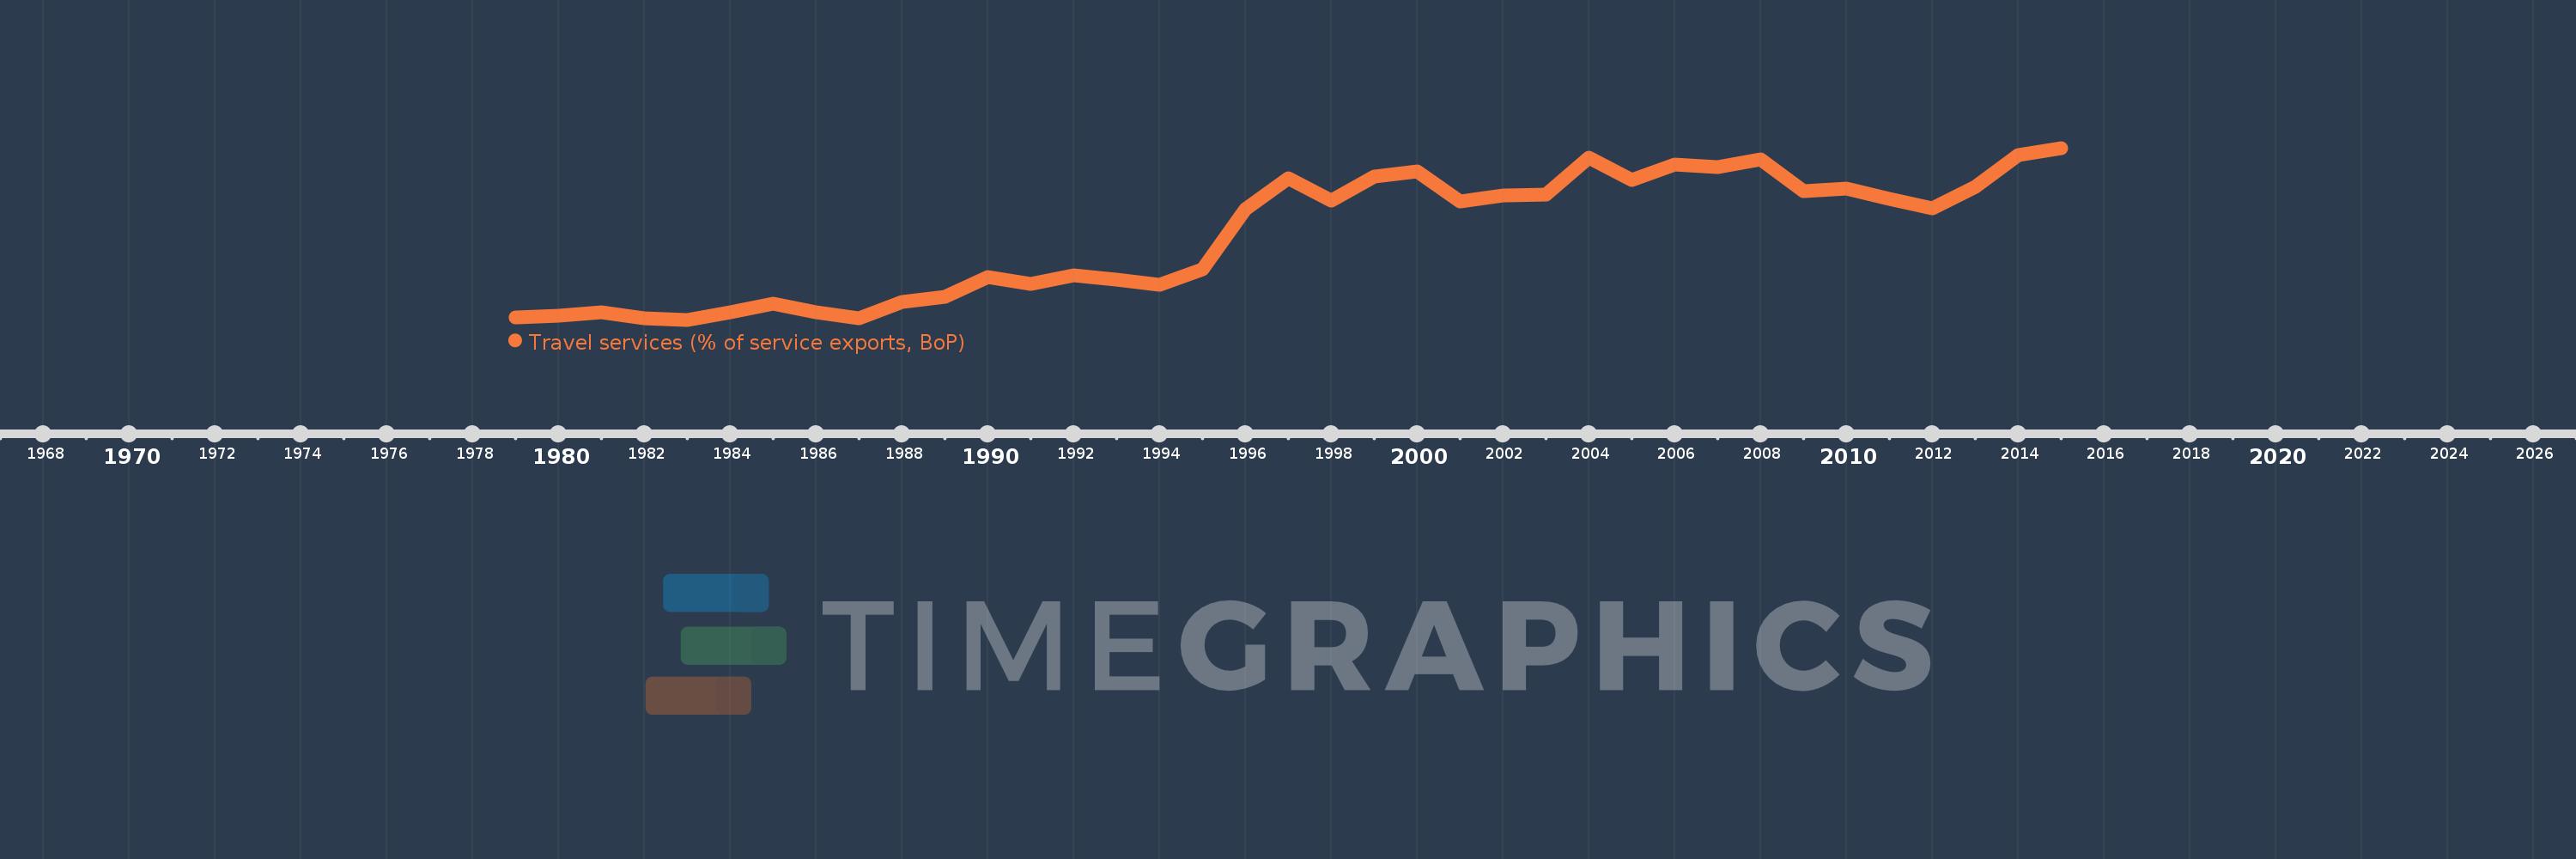
Heavily indebted poor countries (HIPC)
HPC
false
2
1
Travel services (% of service exports, BoP)
2015,2014,2013,2012,2011,2010,2009,2008,2007,2006,2005,2004,2003,2002,2001,2000,1999,1998,1997,1996,1995,1994,1993,1992,1991,1990,1989,1988,1987,1986,1985,1984,1983,1982,1981,1980,1979
Estas estadísticas en otros países:
AfghanistanAlbaniaAlgeriaAngolaAntigua and BarbudaArab WorldArgentinaArmeniaArubaAustraliaAustriaAzerbaijanBahamas, TheBahrainBangladeshBarbadosBelarusBelgiumBelizeBeninBermudaBhutanBoliviaBosnia and HerzegovinaBotswanaBrazilBrunei DarussalamBulgariaBurkina FasoBurundiCabo VerdeCambodiaCameroonCanadaCaribbean small statesCentral African RepublicCentral Europe and the BalticsChadChileChinaColombiaComorosCongo, Dem. Rep.Congo, Rep.Costa RicaCote d'IvoireCroatiaCuracaoCyprusCzech RepublicDenmarkDjiboutiDominicaDominican RepublicEarly-demographic dividendEast Asia & PacificEast Asia & Pacific (excluding high income)East Asia & Pacific (IDA & IBRD countries)EcuadorEgypt, Arab Rep.El SalvadorEritreaEstoniaEthiopiaEuro areaEurope & Central AsiaEurope & Central Asia (excluding high income)Europe & Central Asia (IDA & IBRD countries)European UnionFaroe IslandsFijiFinlandFragile and conflict affected situationsFranceFrench PolynesiaGabonGambia, TheGeorgiaGermanyGhanaGreeceGrenadaGuatemalaGuineaGuinea-BissauGuyanaHaitiHeavily indebted poor countries (HIPC)High incomeHondurasHong Kong SAR, ChinaHungaryIBRD onlyIcelandIDA & IBRD totalIDA onlyIDA totalIndiaIndonesiaIran, Islamic Rep.IraqIrelandIsraelItalyJamaicaJapanJordanKazakhstanKenyaKiribatiKorea, Rep.KosovoKuwaitKyrgyz RepublicLao PDRLate-demographic dividendLatin America & Caribbean Latin America & Caribbean (excluding high income)Latin America & the Caribbean (IDA & IBRD countries)LatviaLeast developed countries: UN classificationLebanonLesothoLiberiaLibyaLithuaniaLow & middle incomeLow incomeLower middle incomeLuxembourgMacao SAR, ChinaMacedonia, FYRMadagascarMalawiMalaysiaMaldivesMaliMaltaMarshall IslandsMauritaniaMauritiusMexicoMicronesia, Fed. Sts.Middle East & North Africa (excluding high income)Middle East & North Africa (IDA & IBRD countries)Middle incomeMoldovaMongoliaMontenegroMoroccoMozambiqueMyanmarNamibiaNepalNetherlandsNew CaledoniaNew ZealandNicaraguaNigerNigeriaNorth AmericaNorwayOECD membersOmanOther small statesPacific island small statesPakistanPalauPanamaPapua New GuineaParaguayPeruPhilippinesPolandPortugalPost-demographic dividendPre-demographic dividendQatarRomaniaRussian FederationRwandaSamoaSao Tome and PrincipeSaudi ArabiaSenegalSerbiaSeychellesSierra LeoneSingaporeSint Maarten (Dutch part)Slovak RepublicSloveniaSmall statesSolomon IslandsSouth AfricaSouth AsiaSouth Asia (IDA & IBRD)South SudanSpainSri LankaSt. Kitts and NevisSt. LuciaSt. Vincent and the GrenadinesSub-Saharan Africa Sub-Saharan Africa (excluding high income)Sub-Saharan Africa (IDA & IBRD countries)SudanSurinameSwazilandSwedenSwitzerlandSyrian Arab RepublicTajikistanTanzaniaThailandTimor-LesteTogoTongaTrinidad and TobagoTunisiaTurkeyTuvaluUgandaUkraineUnited KingdomUnited StatesUpper middle incomeUruguayVanuatuVenezuela, RBWest Bank and GazaWorldYemen, Rep.ZambiaZimbabwe línea de tiempo (timeline):
En esta escala de tiempo se presenta un gráfico de 1979 y 2015 de Heavily indebted poor countries (HIPC). Los datos de 1978 están ausentes. El número de observaciones reales por fecha: 37.
Fuente (nombre):
Indicadores del desarrollo mundial
Fuente (organización):
International Monetary Fund, Balance of Payments Statistics Yearbook and data files.
Categorías:
Economy & Growth, Trade
Se ha actualizado:
23 abr 2017 año
Los indicadores de los cambios de valor en los últimos años
Mínimo:
20.158
1 ene 1983 año
Máximo:
41.772
1 ene 2015 año
A la fecha de observación
Valor
Cambio absoluto
El cambio con respecto al valor anterior
1 ene 1979 año
20.429
+20.429
0.0%
1 ene 1980 año
20.702
+0.272
1.33%
1 ene 1981 año
21.121
+0.42
2.03%
1 ene 1982 año
20.301
-0.821
-3.89%
1 ene 1983 año
20.158
-0.142
-0.7%
1 ene 1984 año
21.136
+0.978
4.85%
1 ene 1985 año
22.135
+1.0
4.73%
1 ene 1986 año
21.077
-1.058
-4.78%
1 ene 1987 año
20.388
-0.69
-3.27%
1 ene 1988 año
22.368
+1.981
9.71%
1 ene 1989 año
23.007
+0.639
2.86%
1 ene 1990 año
25.478
+2.471
10.74%
1 ene 1991 año
24.614
-0.864
-3.39%
1 ene 1992 año
25.704
+1.09
4.43%
1 ene 1993 año
25.182
-0.522
-2.03%
1 ene 1994 año
24.527
-0.655
-2.6%
1 ene 1995 año
26.46
+1.933
7.88%
1 ene 1996 año
34.109
+7.649
28.91%
1 ene 1997 año
37.933
+3.824
11.21%
1 ene 1998 año
35.129
-2.804
-7.39%
1 ene 1999 año
38.15
+3.022
8.6%
1 ene 2000 año
38.861
+0.711
1.86%
1 ene 2001 año
35.034
-3.827
-9.85%
1 ene 2002 año
35.822
+0.788
2.25%
1 ene 2003 año
35.927
+0.105
0.29%
1 ene 2004 año
40.501
+4.574
12.73%
1 ene 2005 año
37.757
-2.744
-6.77%
1 ene 2006 año
39.675
+1.918
5.08%
1 ene 2007 año
39.342
-0.333
-0.84%
1 ene 2008 año
40.292
+0.95
2.41%
1 ene 2009 año
36.376
-3.915
-9.72%
1 ene 2010 año
36.644
+0.267
0.73%
1 ene 2011 año
35.327
-1.316
-3.59%
1 ene 2012 año
34.134
-1.193
-3.38%
1 ene 2013 año
36.899
+2.765
8.1%
1 ene 2014 año
40.914
+4.015
10.88%
1 ene 2015 año
41.772
+0.858
2.1%
Ranking de los países por los datos estadísticos actuales


Comentarios: