29
/es/
es
AIzaSyAYiBZKx7MnpbEhh9jyipgxe19OcubqV5w
April 1, 2024
100720
Cameroon
CMR
true
2
1
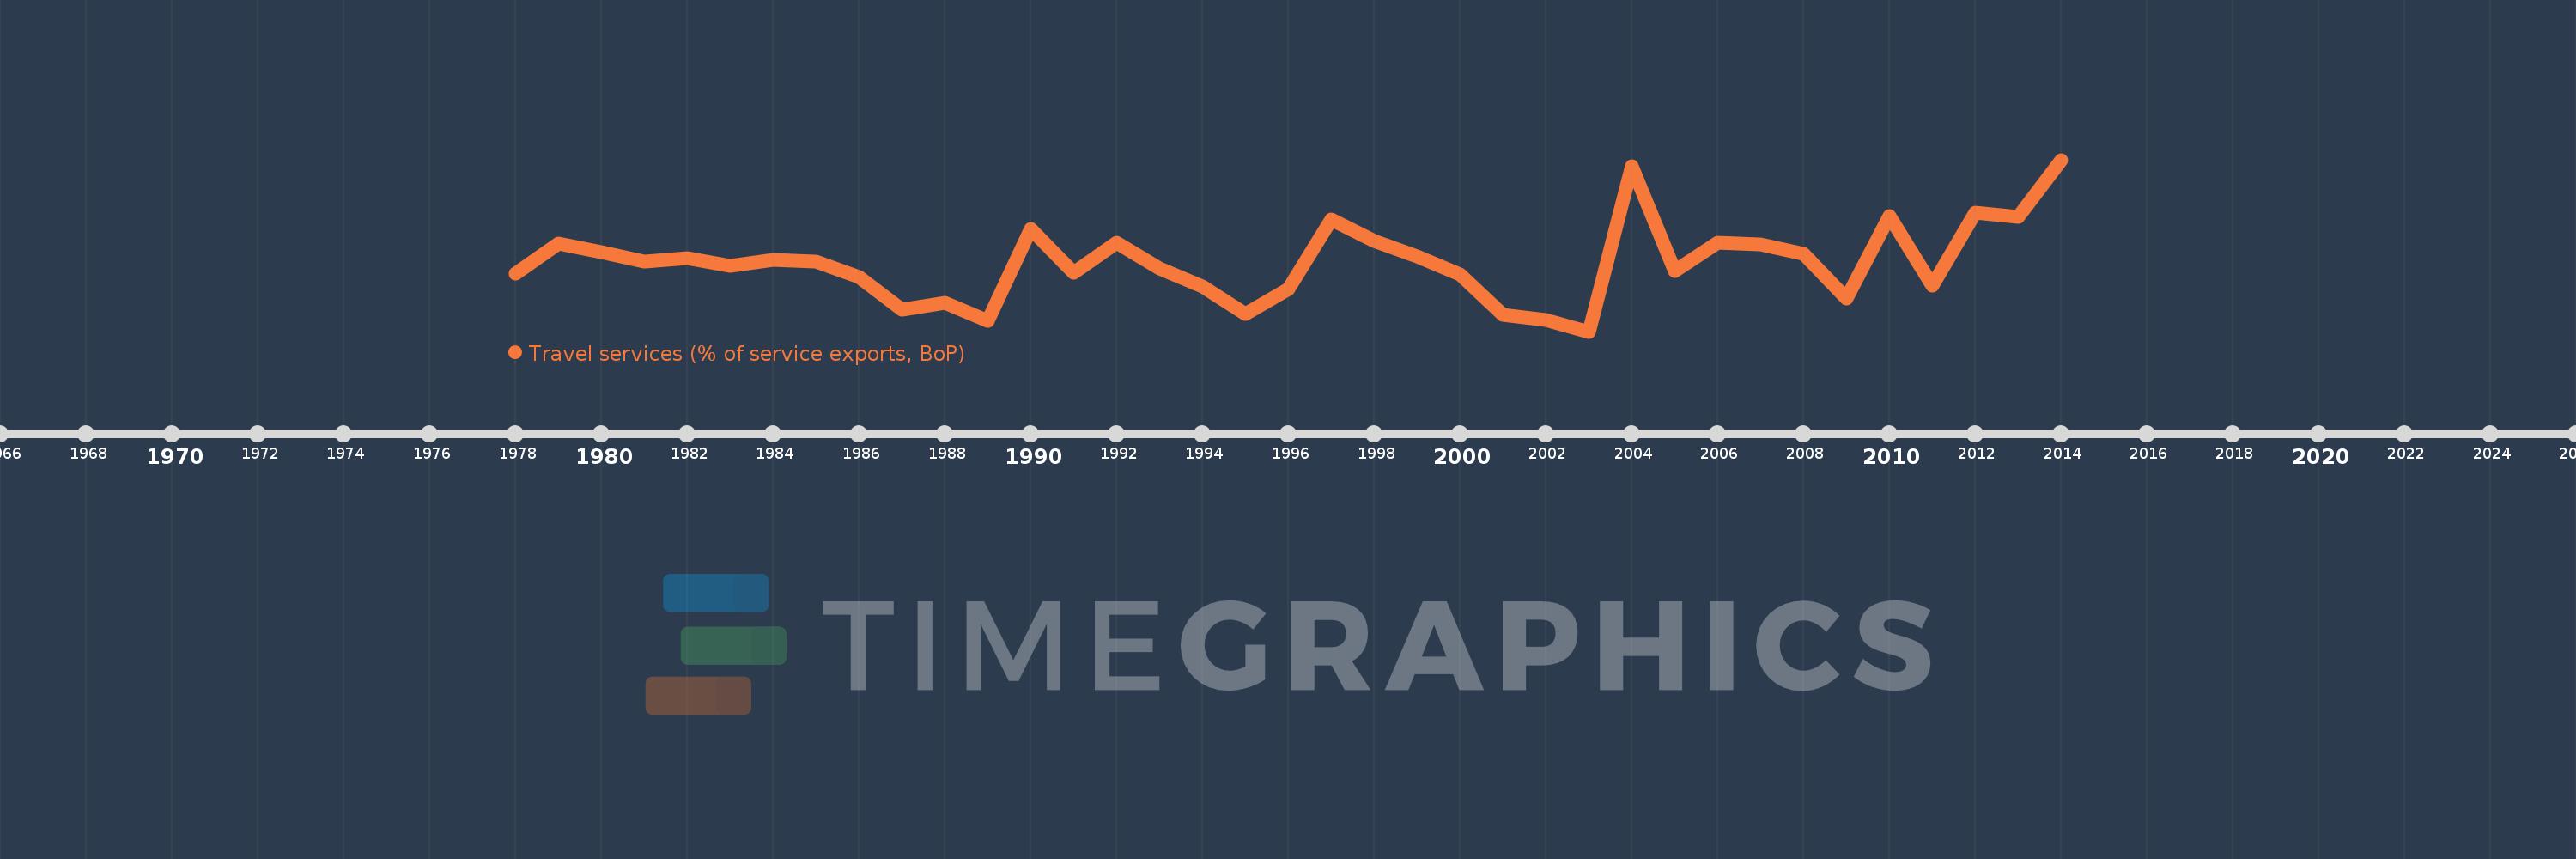
Travel services (% of service exports, BoP)
2014,2013,2012,2011,2010,2009,2008,2007,2006,2005,2004,2003,2002,2001,2000,1999,1998,1997,1996,1995,1994,1993,1992,1991,1990,1989,1988,1987,1986,1985,1984,1983,1982,1981,1980,1979,1978
Estas estadísticas en otros países:
AfghanistanAlbaniaAlgeriaAngolaAntigua and BarbudaArab WorldArgentinaArmeniaArubaAustraliaAustriaAzerbaijanBahamas, TheBahrainBangladeshBarbadosBelarusBelgiumBelizeBeninBermudaBhutanBoliviaBosnia and HerzegovinaBotswanaBrazilBrunei DarussalamBulgariaBurkina FasoBurundiCabo VerdeCambodiaCameroonCanadaCaribbean small statesCentral African RepublicCentral Europe and the BalticsChadChileChinaColombiaComorosCongo, Dem. Rep.Congo, Rep.Costa RicaCote d'IvoireCroatiaCuracaoCyprusCzech RepublicDenmarkDjiboutiDominicaDominican RepublicEarly-demographic dividendEast Asia & PacificEast Asia & Pacific (excluding high income)East Asia & Pacific (IDA & IBRD countries)EcuadorEgypt, Arab Rep.El SalvadorEritreaEstoniaEthiopiaEuro areaEurope & Central AsiaEurope & Central Asia (excluding high income)Europe & Central Asia (IDA & IBRD countries)European UnionFaroe IslandsFijiFinlandFragile and conflict affected situationsFranceFrench PolynesiaGabonGambia, TheGeorgiaGermanyGhanaGreeceGrenadaGuatemalaGuineaGuinea-BissauGuyanaHaitiHeavily indebted poor countries (HIPC)High incomeHondurasHong Kong SAR, ChinaHungaryIBRD onlyIcelandIDA & IBRD totalIDA onlyIDA totalIndiaIndonesiaIran, Islamic Rep.IraqIrelandIsraelItalyJamaicaJapanJordanKazakhstanKenyaKiribatiKorea, Rep.KosovoKuwaitKyrgyz RepublicLao PDRLate-demographic dividendLatin America & Caribbean Latin America & Caribbean (excluding high income)Latin America & the Caribbean (IDA & IBRD countries)LatviaLeast developed countries: UN classificationLebanonLesothoLiberiaLibyaLithuaniaLow & middle incomeLow incomeLower middle incomeLuxembourgMacao SAR, ChinaMacedonia, FYRMadagascarMalawiMalaysiaMaldivesMaliMaltaMarshall IslandsMauritaniaMauritiusMexicoMicronesia, Fed. Sts.Middle East & North Africa (excluding high income)Middle East & North Africa (IDA & IBRD countries)Middle incomeMoldovaMongoliaMontenegroMoroccoMozambiqueMyanmarNamibiaNepalNetherlandsNew CaledoniaNew ZealandNicaraguaNigerNigeriaNorth AmericaNorwayOECD membersOmanOther small statesPacific island small statesPakistanPalauPanamaPapua New GuineaParaguayPeruPhilippinesPolandPortugalPost-demographic dividendPre-demographic dividendQatarRomaniaRussian FederationRwandaSamoaSao Tome and PrincipeSaudi ArabiaSenegalSerbiaSeychellesSierra LeoneSingaporeSint Maarten (Dutch part)Slovak RepublicSloveniaSmall statesSolomon IslandsSouth AfricaSouth AsiaSouth Asia (IDA & IBRD)South SudanSpainSri LankaSt. Kitts and NevisSt. LuciaSt. Vincent and the GrenadinesSub-Saharan Africa Sub-Saharan Africa (excluding high income)Sub-Saharan Africa (IDA & IBRD countries)SudanSurinameSwazilandSwedenSwitzerlandSyrian Arab RepublicTajikistanTanzaniaThailandTimor-LesteTogoTongaTrinidad and TobagoTunisiaTurkeyTuvaluUgandaUkraineUnited KingdomUnited StatesUpper middle incomeUruguayVanuatuVenezuela, RBWest Bank and GazaWorldYemen, Rep.ZambiaZimbabwe línea de tiempo (timeline):
En esta escala de tiempo se presenta un gráfico de 1978 y 2014 de Cameroon. Los datos de 1977 están ausentes. El número de observaciones reales por fecha: 37.
Fuente (nombre):
Indicadores del desarrollo mundial
Fuente (organización):
International Monetary Fund, Balance of Payments Statistics Yearbook and data files.
Categorías:
Economy & Growth, Trade
Se ha actualizado:
23 abr 2017 año
Los indicadores de los cambios de valor en los últimos años
Mínimo:
6.093
1 ene 2003 año
Máximo:
29.112
1 ene 2014 año
A la fecha de observación
Valor
Cambio absoluto
El cambio con respecto al valor anterior
1 ene 1978 año
13.862
+13.862
0.0%
1 ene 1979 año
17.858
+3.996
28.83%
1 ene 1980 año
16.745
-1.113
-6.23%
1 ene 1981 año
15.51
-1.235
-7.37%
1 ene 1982 año
15.966
+0.456
2.94%
1 ene 1983 año
14.87
-1.096
-6.87%
1 ene 1984 año
15.754
+0.884
5.95%
1 ene 1985 año
15.525
-0.229
-1.45%
1 ene 1986 año
13.431
-2.095
-13.49%
1 ene 1987 año
9.049
-4.382
-32.63%
1 ene 1988 año
9.973
+0.924
10.21%
1 ene 1989 año
7.499
-2.474
-24.81%
1 ene 1990 año
19.808
+12.309
164.15%
1 ene 1991 año
13.936
-5.872
-29.65%
1 ene 1992 año
17.96
+4.025
28.88%
1 ene 1993 año
14.567
-3.394
-18.9%
1 ene 1994 año
12.096
-2.471
-16.96%
1 ene 1995 año
8.395
-3.701
-30.6%
1 ene 1996 año
11.775
+3.38
40.26%
1 ene 1997 año
21.063
+9.288
78.87%
1 ene 1998 año
18.226
-2.836
-13.47%
1 ene 1999 año
16.139
-2.087
-11.45%
1 ene 2000 año
13.706
-2.434
-15.08%
1 ene 2001 año
8.286
-5.42
-39.55%
1 ene 2002 año
7.662
-0.623
-7.52%
1 ene 2003 año
6.093
-1.569
-20.48%
1 ene 2004 año
28.279
+22.186
364.11%
1 ene 2005 año
14.225
-14.054
-49.7%
1 ene 2006 año
18.049
+3.824
26.88%
1 ene 2007 año
17.818
-0.231
-1.28%
1 ene 2008 año
16.507
-1.311
-7.36%
1 ene 2009 año
10.503
-6.004
-36.37%
1 ene 2010 año
21.604
+11.101
105.69%
1 ene 2011 año
12.308
-9.296
-43.03%
1 ene 2012 año
22.014
+9.706
78.86%
1 ene 2013 año
21.465
-0.549
-2.49%
1 ene 2014 año
29.112
+7.647
35.63%
Ranking de los países por los datos estadísticos actuales


Comentarios: