29
/es/
es
AIzaSyAYiBZKx7MnpbEhh9jyipgxe19OcubqV5w
April 1, 2024
257897
Switzerland
CHE
true
2
1
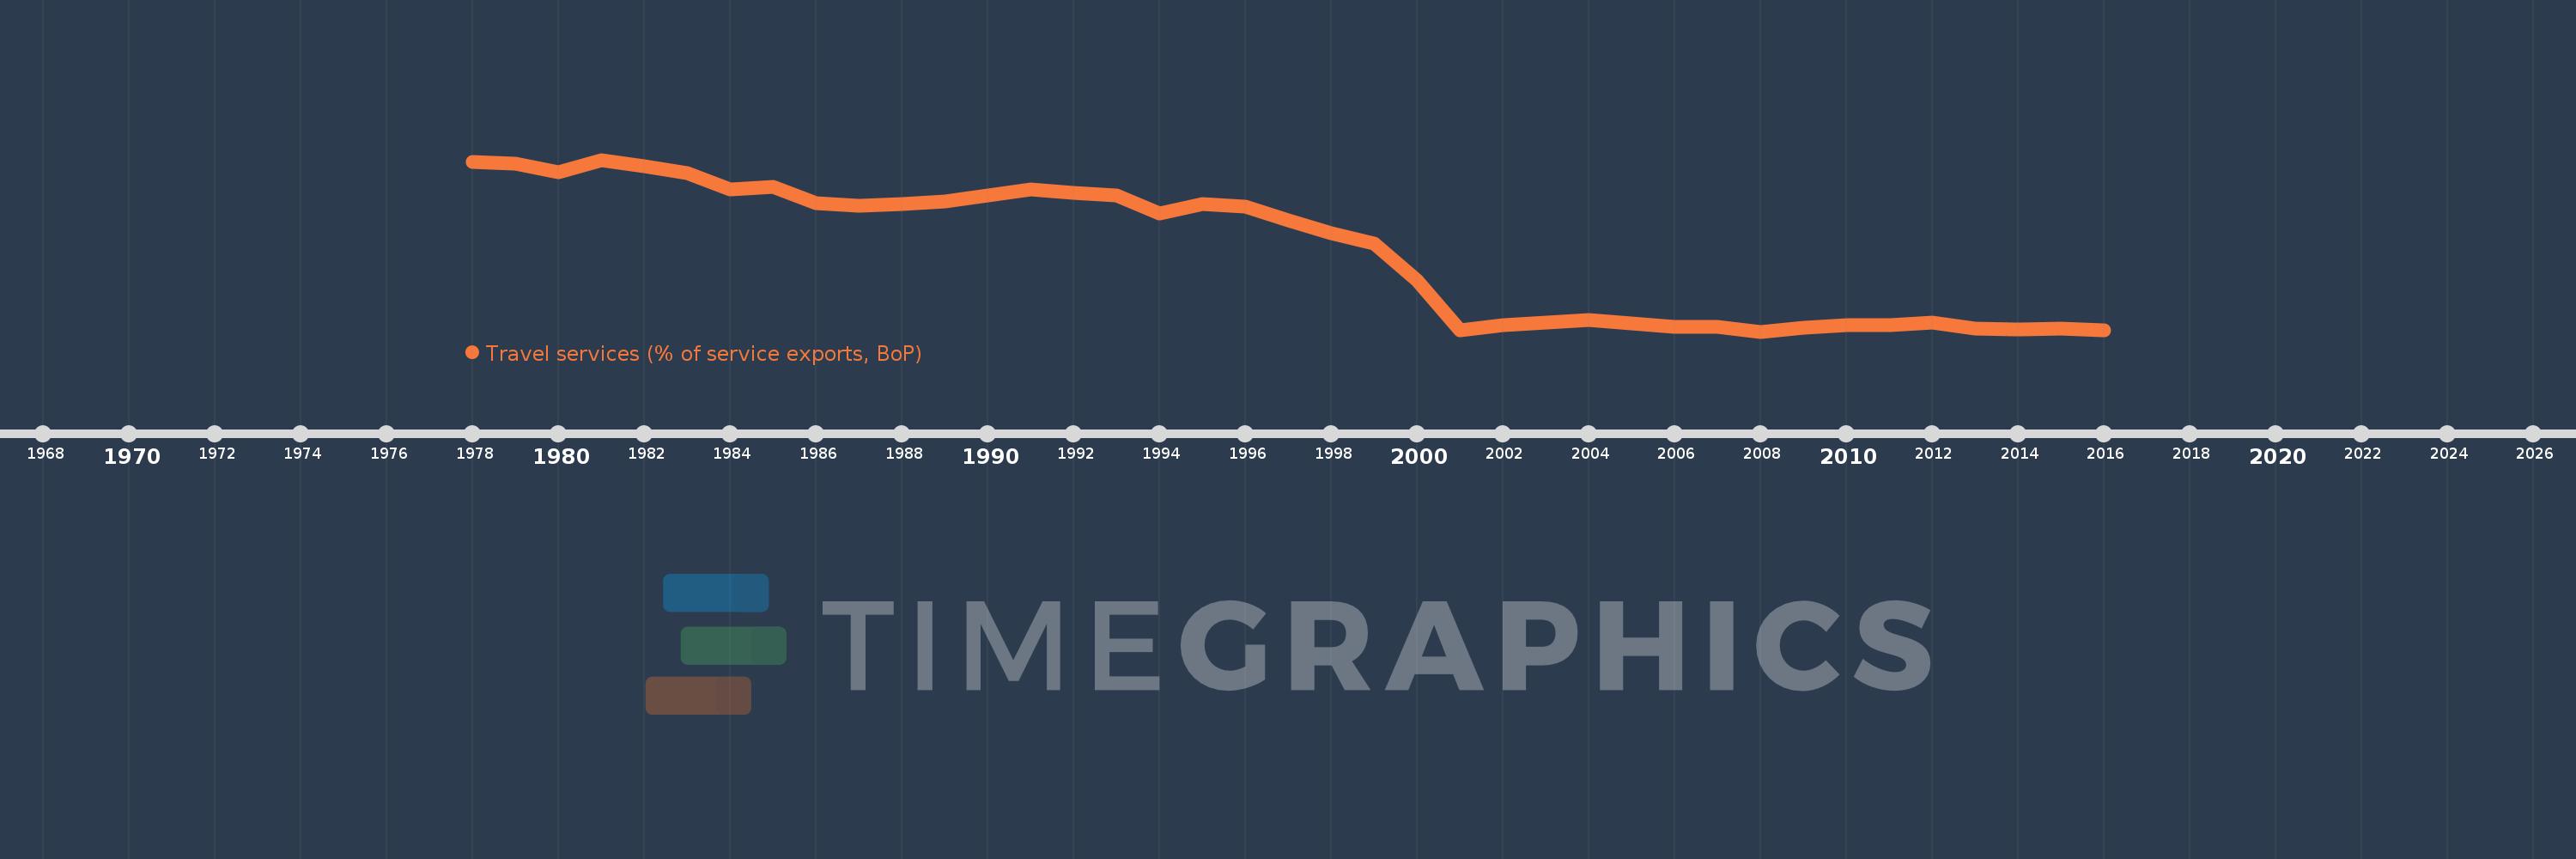
Travel services (% of service exports, BoP)
2016,2015,2014,2013,2012,2011,2010,2009,2008,2007,2006,2005,2004,2003,2002,2001,2000,1999,1998,1997,1996,1995,1994,1993,1992,1991,1990,1989,1988,1987,1986,1985,1984,1983,1982,1981,1980,1979,1978
Estas estadísticas en otros países:
AfghanistanAlbaniaAlgeriaAngolaAntigua and BarbudaArab WorldArgentinaArmeniaArubaAustraliaAustriaAzerbaijanBahamas, TheBahrainBangladeshBarbadosBelarusBelgiumBelizeBeninBermudaBhutanBoliviaBosnia and HerzegovinaBotswanaBrazilBrunei DarussalamBulgariaBurkina FasoBurundiCabo VerdeCambodiaCameroonCanadaCaribbean small statesCentral African RepublicCentral Europe and the BalticsChadChileChinaColombiaComorosCongo, Dem. Rep.Congo, Rep.Costa RicaCote d'IvoireCroatiaCuracaoCyprusCzech RepublicDenmarkDjiboutiDominicaDominican RepublicEarly-demographic dividendEast Asia & PacificEast Asia & Pacific (excluding high income)East Asia & Pacific (IDA & IBRD countries)EcuadorEgypt, Arab Rep.El SalvadorEritreaEstoniaEthiopiaEuro areaEurope & Central AsiaEurope & Central Asia (excluding high income)Europe & Central Asia (IDA & IBRD countries)European UnionFaroe IslandsFijiFinlandFragile and conflict affected situationsFranceFrench PolynesiaGabonGambia, TheGeorgiaGermanyGhanaGreeceGrenadaGuatemalaGuineaGuinea-BissauGuyanaHaitiHeavily indebted poor countries (HIPC)High incomeHondurasHong Kong SAR, ChinaHungaryIBRD onlyIcelandIDA & IBRD totalIDA onlyIDA totalIndiaIndonesiaIran, Islamic Rep.IraqIrelandIsraelItalyJamaicaJapanJordanKazakhstanKenyaKiribatiKorea, Rep.KosovoKuwaitKyrgyz RepublicLao PDRLate-demographic dividendLatin America & Caribbean Latin America & Caribbean (excluding high income)Latin America & the Caribbean (IDA & IBRD countries)LatviaLeast developed countries: UN classificationLebanonLesothoLiberiaLibyaLithuaniaLow & middle incomeLow incomeLower middle incomeLuxembourgMacao SAR, ChinaMacedonia, FYRMadagascarMalawiMalaysiaMaldivesMaliMaltaMarshall IslandsMauritaniaMauritiusMexicoMicronesia, Fed. Sts.Middle East & North Africa (excluding high income)Middle East & North Africa (IDA & IBRD countries)Middle incomeMoldovaMongoliaMontenegroMoroccoMozambiqueMyanmarNamibiaNepalNetherlandsNew CaledoniaNew ZealandNicaraguaNigerNigeriaNorth AmericaNorwayOECD membersOmanOther small statesPacific island small statesPakistanPalauPanamaPapua New GuineaParaguayPeruPhilippinesPolandPortugalPost-demographic dividendPre-demographic dividendQatarRomaniaRussian FederationRwandaSamoaSao Tome and PrincipeSaudi ArabiaSenegalSerbiaSeychellesSierra LeoneSingaporeSint Maarten (Dutch part)Slovak RepublicSloveniaSmall statesSolomon IslandsSouth AfricaSouth AsiaSouth Asia (IDA & IBRD)South SudanSpainSri LankaSt. Kitts and NevisSt. LuciaSt. Vincent and the GrenadinesSub-Saharan Africa Sub-Saharan Africa (excluding high income)Sub-Saharan Africa (IDA & IBRD countries)SudanSurinameSwazilandSwedenSwitzerlandSyrian Arab RepublicTajikistanTanzaniaThailandTimor-LesteTogoTongaTrinidad and TobagoTunisiaTurkeyTuvaluUgandaUkraineUnited KingdomUnited StatesUpper middle incomeUruguayVanuatuVenezuela, RBWest Bank and GazaWorldYemen, Rep.ZambiaZimbabwe línea de tiempo (timeline):
En esta escala de tiempo se presenta un gráfico de 1978 y 2016 de Switzerland. Los datos de 1977 están ausentes. El número de observaciones reales por fecha: 39.
Fuente (nombre):
Indicadores del desarrollo mundial
Fuente (organización):
International Monetary Fund, Balance of Payments Statistics Yearbook and data files.
Categorías:
Economy & Growth, Trade
Se ha actualizado:
23 abr 2017 año
Los indicadores de los cambios de valor en los últimos años
Mínimo:
14.233
1 ene 2008 año
Máximo:
46.033
1 ene 1981 año
A la fecha de observación
Valor
Cambio absoluto
El cambio con respecto al valor anterior
1 ene 1978 año
45.649
+45.649
0.0%
1 ene 1979 año
45.348
-0.301
-0.66%
1 ene 1980 año
43.788
-1.559
-3.44%
1 ene 1981 año
46.033
+2.245
5.13%
1 ene 1982 año
44.797
-1.235
-2.68%
1 ene 1983 año
43.613
-1.184
-2.64%
1 ene 1984 año
40.6
-3.014
-6.91%
1 ene 1985 año
40.973
+0.373
0.92%
1 ene 1986 año
38.057
-2.916
-7.12%
1 ene 1987 año
37.565
-0.492
-1.29%
1 ene 1988 año
37.783
+0.218
0.58%
1 ene 1989 año
38.263
+0.48
1.27%
1 ene 1990 año
39.474
+1.211
3.17%
1 ene 1991 año
40.551
+1.077
2.73%
1 ene 1992 año
39.976
-0.575
-1.42%
1 ene 1993 año
39.513
-0.463
-1.16%
1 ene 1994 año
36.118
-3.396
-8.59%
1 ene 1995 año
37.82
+1.702
4.71%
1 ene 1996 año
37.383
-0.437
-1.16%
1 ene 1997 año
34.789
-2.594
-6.94%
1 ene 1998 año
32.5
-2.289
-6.58%
1 ene 1999 año
30.585
-1.915
-5.89%
1 ene 2000 año
23.697
-6.888
-22.52%
1 ene 2001 año
14.503
-9.194
-38.8%
1 ene 2002 año
15.463
+0.959
6.62%
1 ene 2003 año
15.864
+0.402
2.6%
1 ene 2004 año
16.304
+0.439
2.77%
1 ene 2005 año
15.726
-0.578
-3.54%
1 ene 2006 año
15.15
-0.576
-3.66%
1 ene 2007 año
15.161
+0.012
0.08%
1 ene 2008 año
14.233
-0.929
-6.13%
1 ene 2009 año
14.962
+0.73
5.13%
1 ene 2010 año
15.361
+0.399
2.67%
1 ene 2011 año
15.499
+0.138
0.9%
1 ene 2012 año
15.945
+0.445
2.87%
1 ene 2013 año
14.734
-1.211
-7.59%
1 ene 2014 año
14.655
-0.079
-0.53%
1 ene 2015 año
14.727
+0.071
0.49%
1 ene 2016 año
14.496
-0.231
-1.57%
Ranking de los países por los datos estadísticos actuales


Comentarios: