29
/es/
es
AIzaSyAYiBZKx7MnpbEhh9jyipgxe19OcubqV5w
April 1, 2024
253772
Sudan
SDN
true
2
1
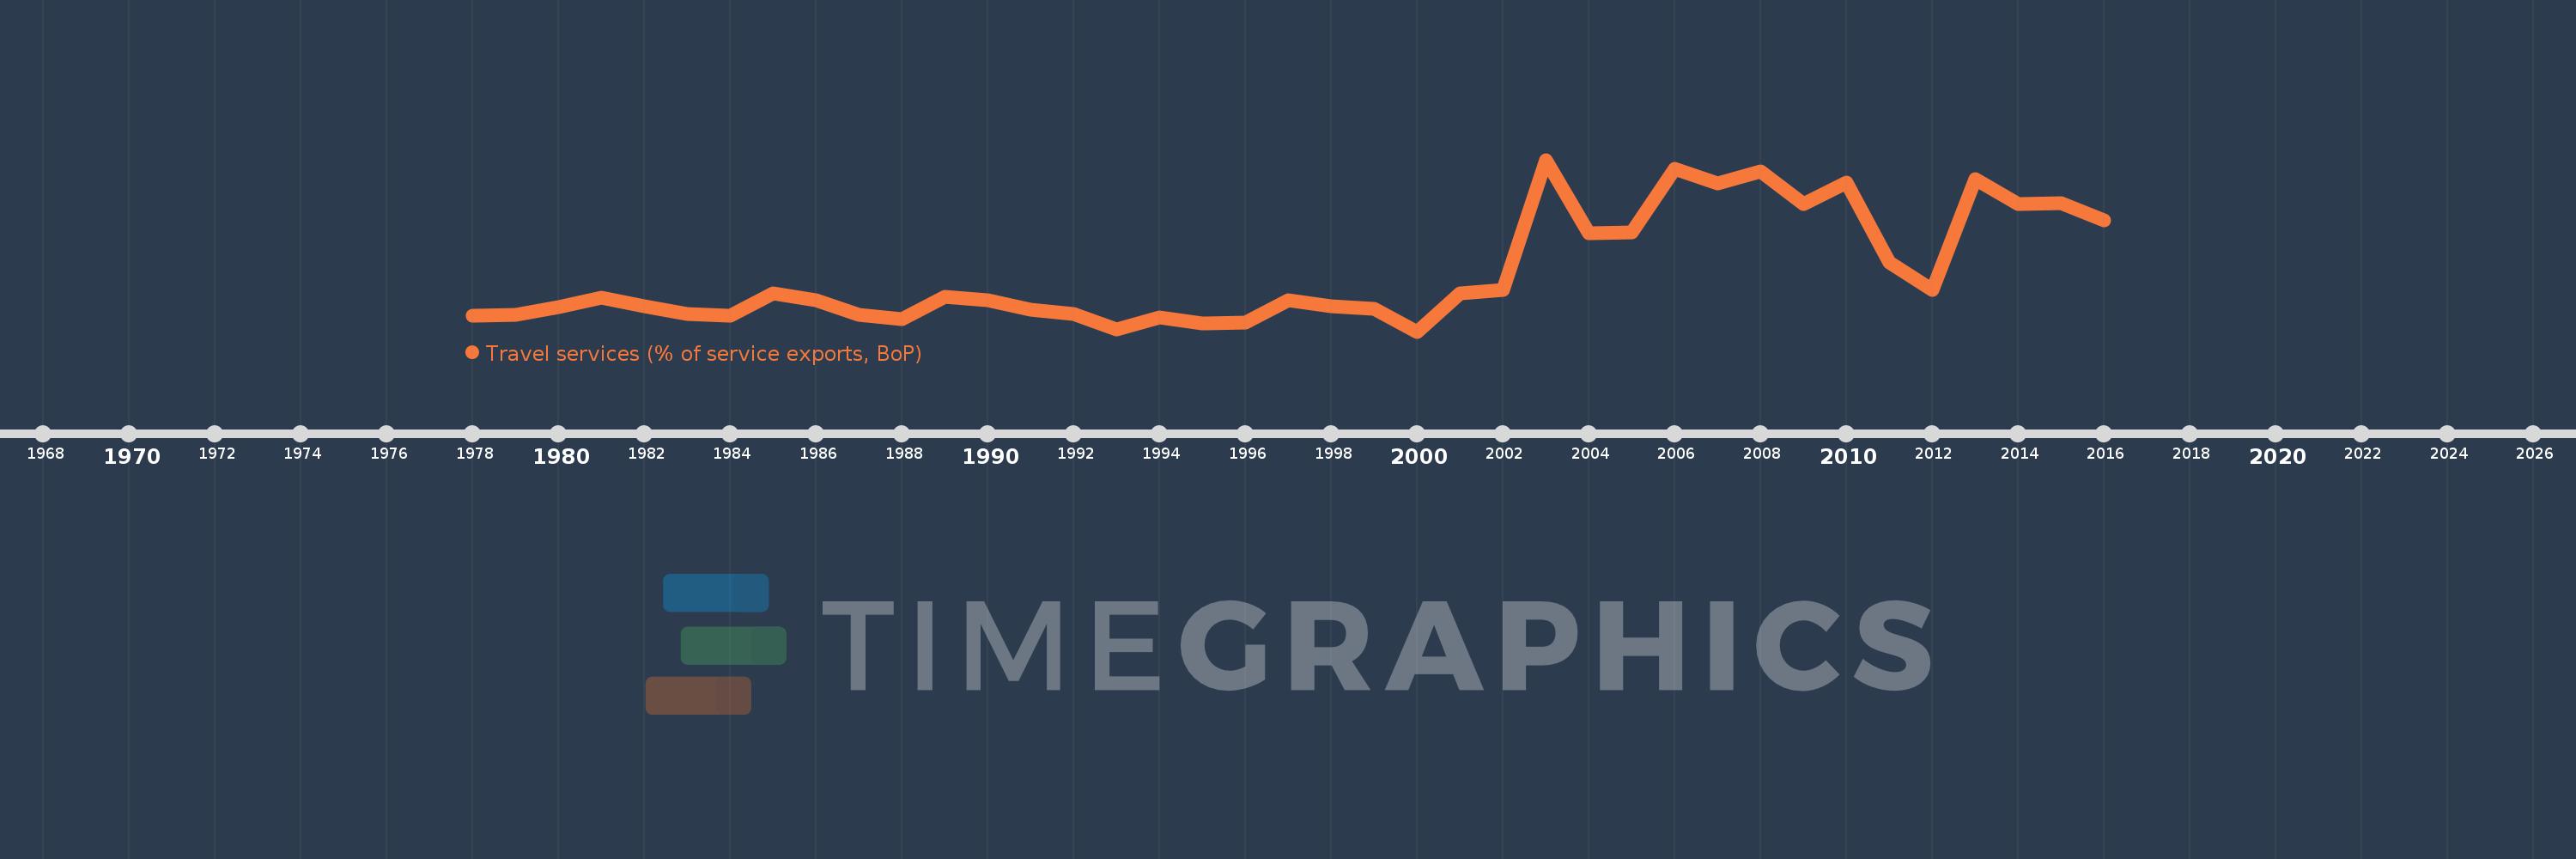
Travel services (% of service exports, BoP)
2016,2015,2014,2013,2012,2011,2010,2009,2008,2007,2006,2005,2004,2003,2002,2001,2000,1999,1998,1997,1996,1995,1994,1993,1992,1991,1990,1989,1988,1987,1986,1985,1984,1983,1982,1981,1980,1979,1978
Estas estadísticas en otros países:
AfghanistanAlbaniaAlgeriaAngolaAntigua and BarbudaArab WorldArgentinaArmeniaArubaAustraliaAustriaAzerbaijanBahamas, TheBahrainBangladeshBarbadosBelarusBelgiumBelizeBeninBermudaBhutanBoliviaBosnia and HerzegovinaBotswanaBrazilBrunei DarussalamBulgariaBurkina FasoBurundiCabo VerdeCambodiaCameroonCanadaCaribbean small statesCentral African RepublicCentral Europe and the BalticsChadChileChinaColombiaComorosCongo, Dem. Rep.Congo, Rep.Costa RicaCote d'IvoireCroatiaCuracaoCyprusCzech RepublicDenmarkDjiboutiDominicaDominican RepublicEarly-demographic dividendEast Asia & PacificEast Asia & Pacific (excluding high income)East Asia & Pacific (IDA & IBRD countries)EcuadorEgypt, Arab Rep.El SalvadorEritreaEstoniaEthiopiaEuro areaEurope & Central AsiaEurope & Central Asia (excluding high income)Europe & Central Asia (IDA & IBRD countries)European UnionFaroe IslandsFijiFinlandFragile and conflict affected situationsFranceFrench PolynesiaGabonGambia, TheGeorgiaGermanyGhanaGreeceGrenadaGuatemalaGuineaGuinea-BissauGuyanaHaitiHeavily indebted poor countries (HIPC)High incomeHondurasHong Kong SAR, ChinaHungaryIBRD onlyIcelandIDA & IBRD totalIDA onlyIDA totalIndiaIndonesiaIran, Islamic Rep.IraqIrelandIsraelItalyJamaicaJapanJordanKazakhstanKenyaKiribatiKorea, Rep.KosovoKuwaitKyrgyz RepublicLao PDRLate-demographic dividendLatin America & Caribbean Latin America & Caribbean (excluding high income)Latin America & the Caribbean (IDA & IBRD countries)LatviaLeast developed countries: UN classificationLebanonLesothoLiberiaLibyaLithuaniaLow & middle incomeLow incomeLower middle incomeLuxembourgMacao SAR, ChinaMacedonia, FYRMadagascarMalawiMalaysiaMaldivesMaliMaltaMarshall IslandsMauritaniaMauritiusMexicoMicronesia, Fed. Sts.Middle East & North Africa (excluding high income)Middle East & North Africa (IDA & IBRD countries)Middle incomeMoldovaMongoliaMontenegroMoroccoMozambiqueMyanmarNamibiaNepalNetherlandsNew CaledoniaNew ZealandNicaraguaNigerNigeriaNorth AmericaNorwayOECD membersOmanOther small statesPacific island small statesPakistanPalauPanamaPapua New GuineaParaguayPeruPhilippinesPolandPortugalPost-demographic dividendPre-demographic dividendQatarRomaniaRussian FederationRwandaSamoaSao Tome and PrincipeSaudi ArabiaSenegalSerbiaSeychellesSierra LeoneSingaporeSint Maarten (Dutch part)Slovak RepublicSloveniaSmall statesSolomon IslandsSouth AfricaSouth AsiaSouth Asia (IDA & IBRD)South SudanSpainSri LankaSt. Kitts and NevisSt. LuciaSt. Vincent and the GrenadinesSub-Saharan Africa Sub-Saharan Africa (excluding high income)Sub-Saharan Africa (IDA & IBRD countries)SudanSurinameSwazilandSwedenSwitzerlandSyrian Arab RepublicTajikistanTanzaniaThailandTimor-LesteTogoTongaTrinidad and TobagoTunisiaTurkeyTuvaluUgandaUkraineUnited KingdomUnited StatesUpper middle incomeUruguayVanuatuVenezuela, RBWest Bank and GazaWorldYemen, Rep.ZambiaZimbabwe línea de tiempo (timeline):
En esta escala de tiempo se presenta un gráfico de 1978 y 2016 de Sudan. Los datos de 1977 están ausentes. El número de observaciones reales por fecha: 39.
Fuente (nombre):
Indicadores del desarrollo mundial
Fuente (organización):
International Monetary Fund, Balance of Payments Statistics Yearbook and data files.
Categorías:
Economy & Growth, Trade
Se ha actualizado:
23 abr 2017 año
Los indicadores de los cambios de valor en los últimos años
Mínimo:
2.083
1 ene 2000 año
Máximo:
81.789
1 ene 2003 año
A la fecha de observación
Valor
Cambio absoluto
El cambio con respecto al valor anterior
1 ene 1978 año
9.501
+9.501
0.0%
1 ene 1979 año
9.756
+0.254
2.68%
1 ene 1980 año
13.417
+3.662
37.54%
1 ene 1981 año
17.921
+4.503
33.56%
1 ene 1982 año
13.823
-4.097
-22.86%
1 ene 1983 año
10.104
-3.719
-26.91%
1 ene 1984 año
9.514
-0.59
-5.84%
1 ene 1985 año
19.911
+10.396
109.27%
1 ene 1986 año
16.613
-3.297
-16.56%
1 ene 1987 año
9.722
-6.891
-41.48%
1 ene 1988 año
7.759
-1.964
-20.2%
1 ene 1989 año
18.194
+10.436
134.51%
1 ene 1990 año
16.595
-1.6
-8.79%
1 ene 1991 año
12.174
-4.421
-26.64%
1 ene 1992 año
10.39
-1.784
-14.66%
1 ene 1993 año
3.215
-7.174
-69.05%
1 ene 1994 año
8.501
+5.286
164.39%
1 ene 1995 año
5.774
-2.727
-32.08%
1 ene 1996 año
6.305
+0.531
9.19%
1 ene 1997 año
16.568
+10.263
162.78%
1 ene 1998 año
13.651
-2.917
-17.61%
1 ene 1999 año
12.658
-0.993
-7.27%
1 ene 2000 año
2.083
-10.575
-83.54%
1 ene 2001 año
19.708
+17.625
845.99%
1 ene 2002 año
21.233
+1.525
7.74%
1 ene 2003 año
81.789
+60.556
285.2%
1 ene 2004 año
47.862
-33.927
-41.48%
1 ene 2005 año
47.995
+0.133
0.28%
1 ene 2006 año
77.529
+29.535
61.54%
1 ene 2007 año
70.854
-6.675
-8.61%
1 ene 2008 año
76.35
+5.495
7.76%
1 ene 2009 año
61.153
-15.196
-19.9%
1 ene 2010 año
71.188
+10.034
16.41%
1 ene 2011 año
34.001
-37.187
-52.24%
1 ene 2012 año
21.527
-12.474
-36.69%
1 ene 2013 año
72.894
+51.368
238.62%
1 ene 2014 año
61.447
-11.447
-15.7%
1 ene 2015 año
61.675
+0.228
0.37%
1 ene 2016 año
53.7
-7.976
-12.93%
Ranking de los países por los datos estadísticos actuales


Comentarios: