29
/es/
es
AIzaSyAYiBZKx7MnpbEhh9jyipgxe19OcubqV5w
April 1, 2024
156841
Indonesia
IDN
true
2
1
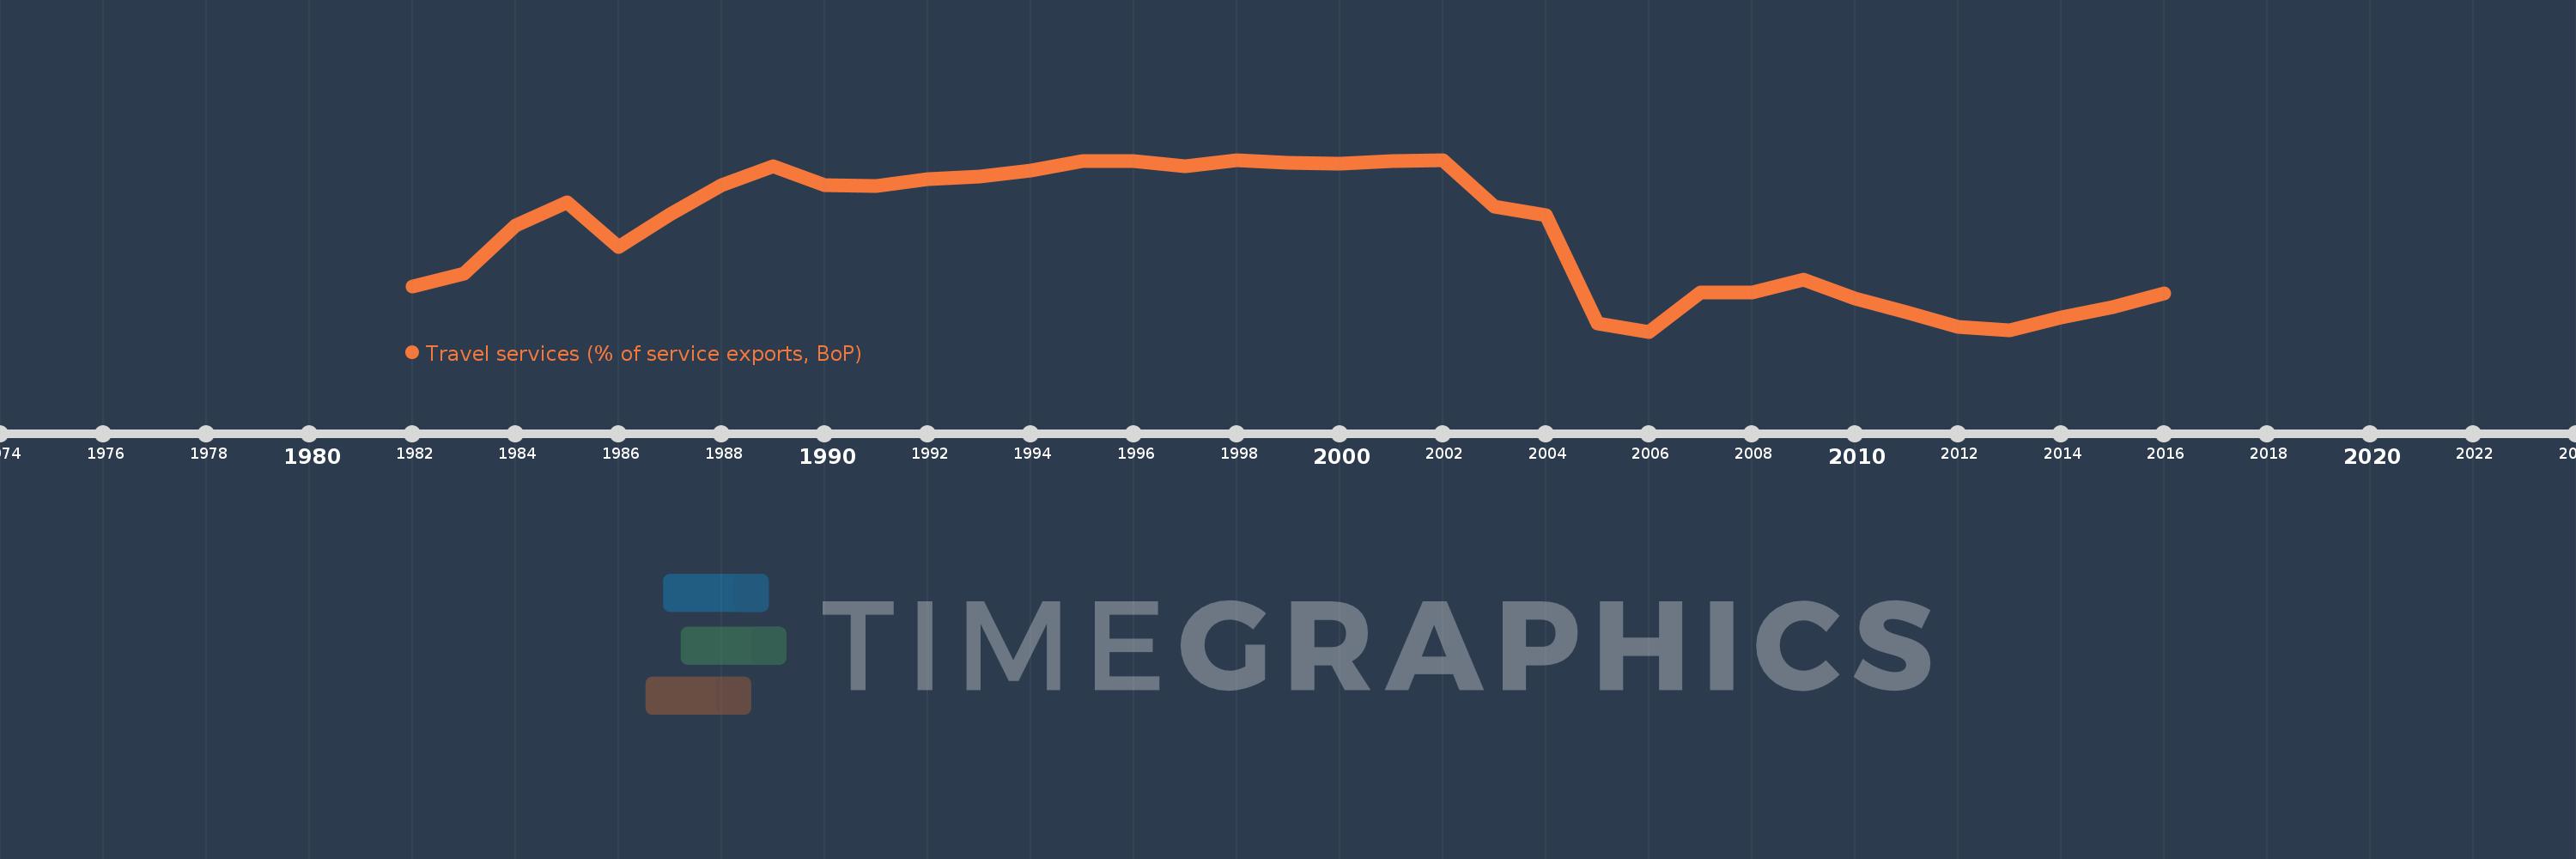
Travel services (% of service exports, BoP)
2016,2015,2014,2013,2012,2011,2010,2009,2008,2007,2006,2005,2004,2003,2002,2001,2000,1999,1998,1997,1996,1995,1994,1993,1992,1991,1990,1989,1988,1987,1986,1985,1984,1983,1982
Estas estadísticas en otros países:
AfghanistanAlbaniaAlgeriaAngolaAntigua and BarbudaArab WorldArgentinaArmeniaArubaAustraliaAustriaAzerbaijanBahamas, TheBahrainBangladeshBarbadosBelarusBelgiumBelizeBeninBermudaBhutanBoliviaBosnia and HerzegovinaBotswanaBrazilBrunei DarussalamBulgariaBurkina FasoBurundiCabo VerdeCambodiaCameroonCanadaCaribbean small statesCentral African RepublicCentral Europe and the BalticsChadChileChinaColombiaComorosCongo, Dem. Rep.Congo, Rep.Costa RicaCote d'IvoireCroatiaCuracaoCyprusCzech RepublicDenmarkDjiboutiDominicaDominican RepublicEarly-demographic dividendEast Asia & PacificEast Asia & Pacific (excluding high income)East Asia & Pacific (IDA & IBRD countries)EcuadorEgypt, Arab Rep.El SalvadorEritreaEstoniaEthiopiaEuro areaEurope & Central AsiaEurope & Central Asia (excluding high income)Europe & Central Asia (IDA & IBRD countries)European UnionFaroe IslandsFijiFinlandFragile and conflict affected situationsFranceFrench PolynesiaGabonGambia, TheGeorgiaGermanyGhanaGreeceGrenadaGuatemalaGuineaGuinea-BissauGuyanaHaitiHeavily indebted poor countries (HIPC)High incomeHondurasHong Kong SAR, ChinaHungaryIBRD onlyIcelandIDA & IBRD totalIDA onlyIDA totalIndiaIndonesiaIran, Islamic Rep.IraqIrelandIsraelItalyJamaicaJapanJordanKazakhstanKenyaKiribatiKorea, Rep.KosovoKuwaitKyrgyz RepublicLao PDRLate-demographic dividendLatin America & Caribbean Latin America & Caribbean (excluding high income)Latin America & the Caribbean (IDA & IBRD countries)LatviaLeast developed countries: UN classificationLebanonLesothoLiberiaLibyaLithuaniaLow & middle incomeLow incomeLower middle incomeLuxembourgMacao SAR, ChinaMacedonia, FYRMadagascarMalawiMalaysiaMaldivesMaliMaltaMarshall IslandsMauritaniaMauritiusMexicoMicronesia, Fed. Sts.Middle East & North Africa (excluding high income)Middle East & North Africa (IDA & IBRD countries)Middle incomeMoldovaMongoliaMontenegroMoroccoMozambiqueMyanmarNamibiaNepalNetherlandsNew CaledoniaNew ZealandNicaraguaNigerNigeriaNorth AmericaNorwayOECD membersOmanOther small statesPacific island small statesPakistanPalauPanamaPapua New GuineaParaguayPeruPhilippinesPolandPortugalPost-demographic dividendPre-demographic dividendQatarRomaniaRussian FederationRwandaSamoaSao Tome and PrincipeSaudi ArabiaSenegalSerbiaSeychellesSierra LeoneSingaporeSint Maarten (Dutch part)Slovak RepublicSloveniaSmall statesSolomon IslandsSouth AfricaSouth AsiaSouth Asia (IDA & IBRD)South SudanSpainSri LankaSt. Kitts and NevisSt. LuciaSt. Vincent and the GrenadinesSub-Saharan Africa Sub-Saharan Africa (excluding high income)Sub-Saharan Africa (IDA & IBRD countries)SudanSurinameSwazilandSwedenSwitzerlandSyrian Arab RepublicTajikistanTanzaniaThailandTimor-LesteTogoTongaTrinidad and TobagoTunisiaTurkeyTuvaluUgandaUkraineUnited KingdomUnited StatesUpper middle incomeUruguayVanuatuVenezuela, RBWest Bank and GazaWorldYemen, Rep.ZambiaZimbabwe línea de tiempo (timeline):
En esta escala de tiempo se presenta un gráfico de 1982 y 2016 de Indonesia. Los datos de 1981 están ausentes. El número de observaciones reales por fecha: 35.
Fuente (nombre):
Indicadores del desarrollo mundial
Fuente (organización):
International Monetary Fund, Balance of Payments Statistics Yearbook and data files.
Categorías:
Economy & Growth, Trade
Se ha actualizado:
23 abr 2017 año
Los indicadores de los cambios de valor en los últimos años
Mínimo:
34.791
1 ene 2006 año
Máximo:
95.928
1 ene 2002 año
A la fecha de observación
Valor
Cambio absoluto
El cambio con respecto al valor anterior
1 ene 1982 año
50.78
+50.78
0.0%
1 ene 1983 año
55.556
+4.776
9.41%
1 ene 1984 año
72.527
+16.972
30.55%
1 ene 1985 año
80.702
+8.174
11.27%
1 ene 1986 año
64.929
-15.773
-19.54%
1 ene 1987 año
76.659
+11.73
18.07%
1 ene 1988 año
86.761
+10.102
13.18%
1 ene 1989 año
93.718
+6.957
8.02%
1 ene 1990 año
86.827
-6.891
-7.35%
1 ene 1991 año
86.535
-0.291
-0.34%
1 ene 1992 año
89.121
+2.586
2.99%
1 ene 1993 año
89.973
+0.852
0.96%
1 ene 1994 año
92.22
+2.247
2.5%
1 ene 1995 año
95.372
+3.152
3.42%
1 ene 1996 año
95.612
+0.24
0.25%
1 ene 1997 año
93.711
-1.9
-1.99%
1 ene 1998 año
95.779
+2.068
2.21%
1 ene 1999 año
94.999
-0.78
-0.81%
1 ene 2000 año
94.646
-0.353
-0.37%
1 ene 2001 año
95.408
+0.762
0.8%
1 ene 2002 año
95.928
+0.52
0.54%
1 ene 2003 año
79.321
-16.607
-17.31%
1 ene 2004 año
76.273
-3.048
-3.84%
1 ene 2005 año
37.691
-38.582
-50.58%
1 ene 2006 año
34.791
-2.899
-7.69%
1 ene 2007 año
48.617
+13.825
39.74%
1 ene 2008 año
48.759
+0.142
0.29%
1 ene 2009 año
53.284
+4.525
9.28%
1 ene 2010 año
46.434
-6.85
-12.86%
1 ene 2011 año
41.738
-4.696
-10.11%
1 ene 2012 año
36.534
-5.204
-12.47%
1 ene 2013 año
35.18
-1.354
-3.71%
1 ene 2014 año
39.746
+4.566
12.98%
1 ene 2015 año
43.607
+3.861
9.72%
1 ene 2016 año
48.411
+4.804
11.02%
Ranking de los países por los datos estadísticos actuales


Comentarios: