29
/es/
es
AIzaSyAYiBZKx7MnpbEhh9jyipgxe19OcubqV5w
April 1, 2024
30523
Europe & Central Asia
ECS
false
2
1
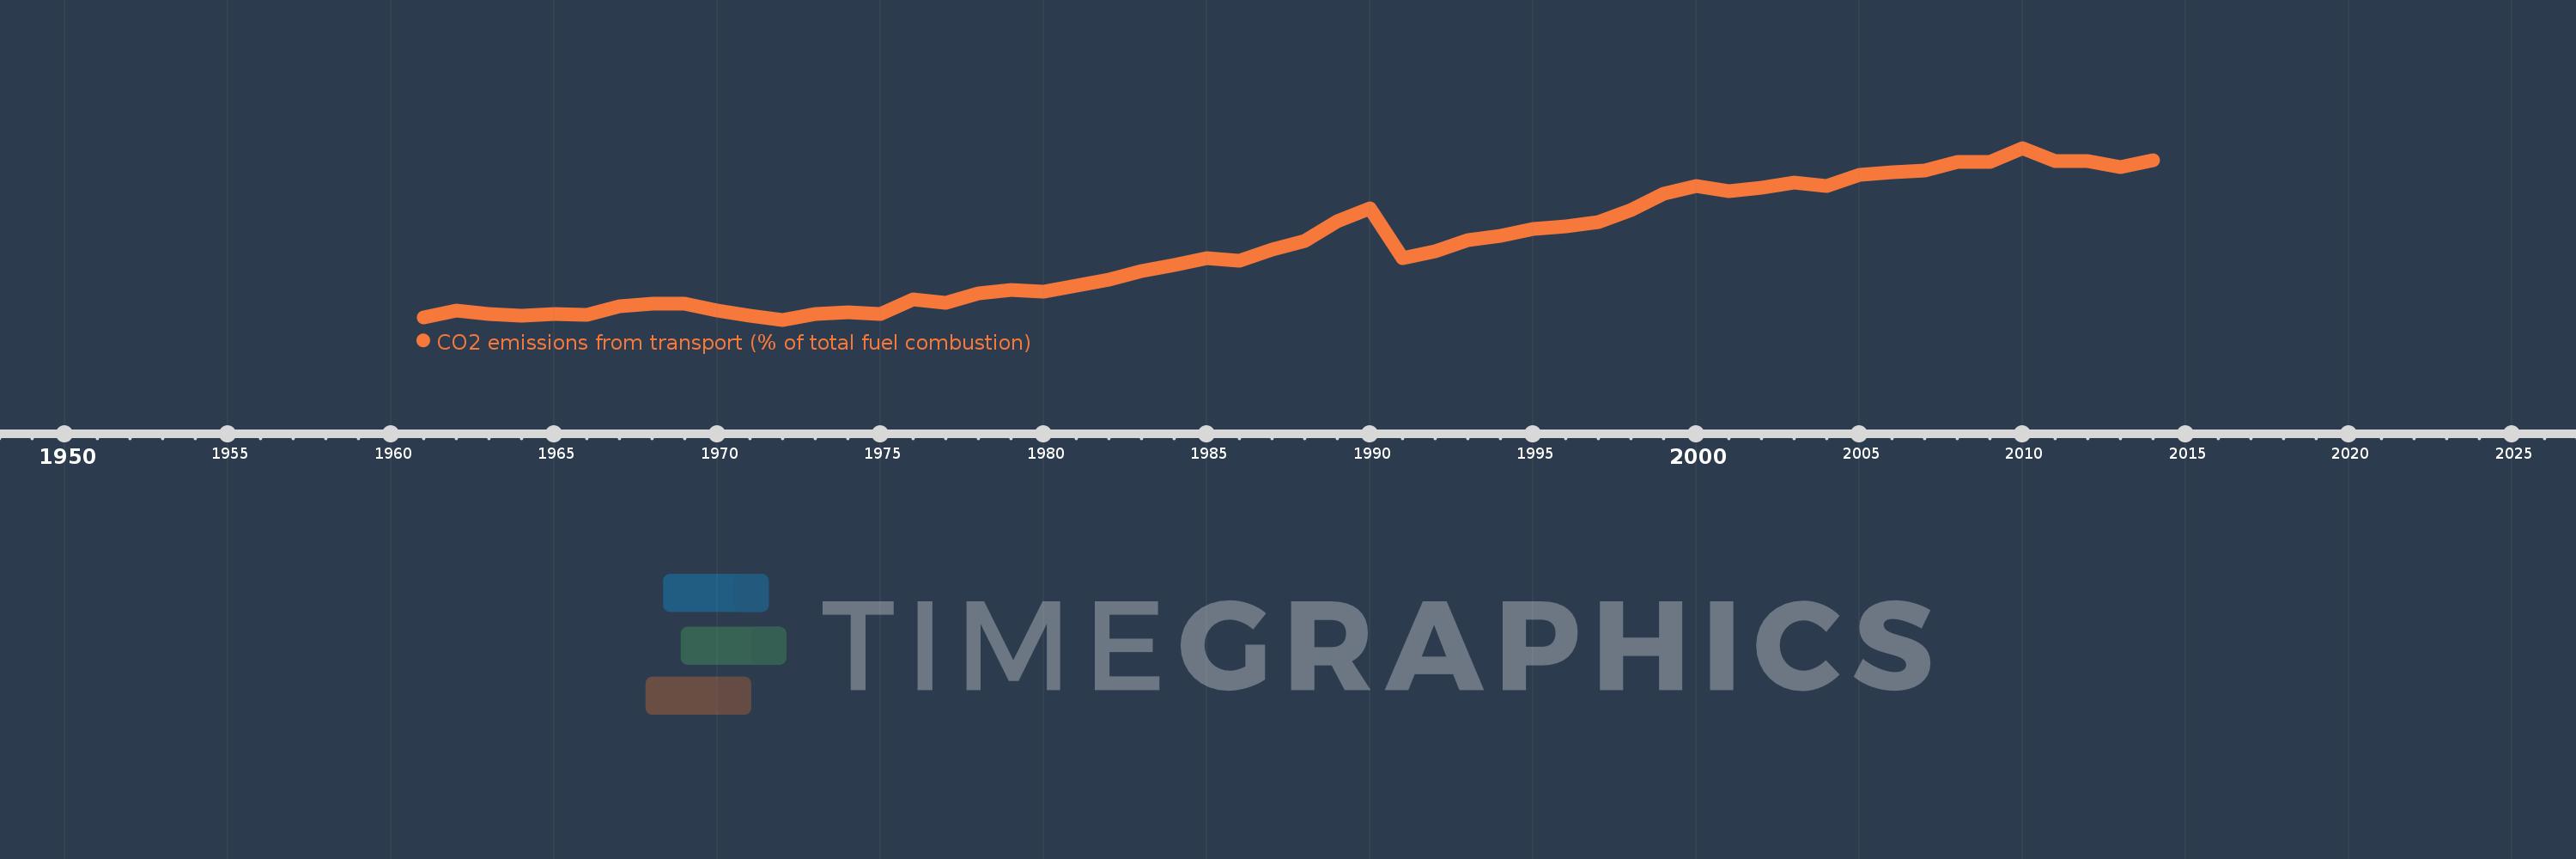
CO2 emissions from transport (% of total fuel combustion)
2014,2013,2012,2011,2010,2009,2008,2007,2006,2005,2004,2003,2002,2001,2000,1999,1998,1997,1996,1995,1994,1993,1992,1991,1990,1989,1988,1987,1986,1985,1984,1983,1982,1981,1980,1979,1978,1977,1976,1975,1974,1973,1972,1971,1970,1969,1968,1967,1966,1965,1964,1963,1962,1961
Estas estadísticas en otros países:
AlbaniaAlgeriaAngolaArab WorldArgentinaArmeniaAustraliaAustriaAzerbaijanBahrainBangladeshBelarusBelgiumBeninBoliviaBosnia and HerzegovinaBotswanaBrazilBrunei DarussalamBulgariaCambodiaCameroonCanadaCaribbean small statesCentral Europe and the BalticsChileChinaColombiaCongo, Dem. Rep.Congo, Rep.Costa RicaCote d'IvoireCroatiaCubaCuracaoCyprusCzech RepublicDenmarkDominican RepublicEarly-demographic dividendEast Asia & PacificEast Asia & Pacific (excluding high income)East Asia & Pacific (IDA & IBRD countries)EcuadorEgypt, Arab Rep.El SalvadorEritreaEstoniaEthiopiaEuro areaEurope & Central AsiaEurope & Central Asia (excluding high income)Europe & Central Asia (IDA & IBRD countries)European UnionFinlandFragile and conflict affected situationsFranceGabonGeorgiaGermanyGhanaGibraltarGreeceGuatemalaHaitiHeavily indebted poor countries (HIPC)High incomeHondurasHong Kong SAR, ChinaHungaryIBRD onlyIcelandIDA & IBRD totalIDA blendIDA onlyIDA totalIndiaIndonesiaIran, Islamic Rep.IraqIrelandIsraelItalyJamaicaJapanJordanKazakhstanKenyaKorea, Dem. People’s Rep.Korea, Rep.KosovoKuwaitKyrgyz RepublicLate-demographic dividendLatin America & Caribbean Latin America & Caribbean (excluding high income)Latin America & the Caribbean (IDA & IBRD countries)LatviaLeast developed countries: UN classificationLebanonLibyaLithuaniaLow & middle incomeLow incomeLower middle incomeLuxembourgMacedonia, FYRMalaysiaMaltaMauritiusMexicoMiddle East & North AfricaMiddle East & North Africa (excluding high income)Middle East & North Africa (IDA & IBRD countries)Middle incomeMoldovaMongoliaMontenegroMoroccoMozambiqueMyanmarNamibiaNepalNetherlandsNew ZealandNicaraguaNigerNigeriaNorth AmericaNorwayOECD membersOmanOther small statesPakistanPanamaParaguayPeruPhilippinesPolandPortugalPost-demographic dividendPre-demographic dividendQatarRomaniaRussian FederationSaudi ArabiaSenegalSerbiaSingaporeSlovak RepublicSloveniaSmall statesSouth AfricaSouth AsiaSouth Asia (IDA & IBRD)South SudanSpainSri LankaSub-Saharan Africa Sub-Saharan Africa (excluding high income)Sub-Saharan Africa (IDA & IBRD countries)SudanSwedenSwitzerlandSyrian Arab RepublicTajikistanTanzaniaThailandTogoTrinidad and TobagoTunisiaTurkeyTurkmenistanUkraineUnited Arab EmiratesUnited KingdomUnited StatesUpper middle incomeUruguayUzbekistanVenezuela, RBVietnamWorldYemen, Rep.ZambiaZimbabwe línea de tiempo (timeline):
En esta escala de tiempo se presenta un gráfico de 1961 y 2014 de Europe & Central Asia. Los datos de 1960 están ausentes. El número de observaciones reales por fecha: 54.
Fuente (nombre):
Indicadores del desarrollo mundial
Fuente (organización):
IEA Statistics © OECD/IEA 2014 (http://www.iea.org/stats/index.asp), subject to https://www.iea.org/t&c/termsandconditions/
Categorías:
Environment
Se ha actualizado:
23 abr 2017 año
Los indicadores de los cambios de valor en los últimos años
Mínimo:
12.424
1 ene 1972 año
Máximo:
21.714
1 ene 2010 año
A la fecha de observación
Valor
Cambio absoluto
El cambio con respecto al valor anterior
1 ene 1961 año
12.555
+12.555
0.0%
1 ene 1962 año
12.936
+0.381
3.04%
1 ene 1963 año
12.718
-0.218
-1.69%
1 ene 1964 año
12.648
-0.07
-0.55%
1 ene 1965 año
12.738
+0.09
0.71%
1 ene 1966 año
12.674
-0.065
-0.51%
1 ene 1967 año
13.162
+0.488
3.85%
1 ene 1968 año
13.274
+0.112
0.85%
1 ene 1969 año
13.315
+0.041
0.31%
1 ene 1970 año
12.92
-0.395
-2.97%
1 ene 1971 año
12.623
-0.297
-2.3%
1 ene 1972 año
12.424
-0.199
-1.58%
1 ene 1973 año
12.718
+0.294
2.37%
1 ene 1974 año
12.814
+0.096
0.75%
1 ene 1975 año
12.758
-0.056
-0.43%
1 ene 1976 año
13.548
+0.79
6.19%
1 ene 1977 año
13.357
-0.191
-1.41%
1 ene 1978 año
13.829
+0.473
3.54%
1 ene 1979 año
14.044
+0.215
1.55%
1 ene 1980 año
13.925
-0.12
-0.85%
1 ene 1981 año
14.276
+0.352
2.52%
1 ene 1982 año
14.599
+0.323
2.26%
1 ene 1983 año
15.045
+0.446
3.06%
1 ene 1984 año
15.398
+0.352
2.34%
1 ene 1985 año
15.751
+0.354
2.3%
1 ene 1986 año
15.627
-0.124
-0.79%
1 ene 1987 año
16.217
+0.59
3.78%
1 ene 1988 año
16.681
+0.464
2.86%
1 ene 1989 año
17.732
+1.051
6.3%
1 ene 1990 año
18.447
+0.715
4.03%
1 ene 1991 año
15.735
-2.712
-14.7%
1 ene 1992 año
16.135
+0.4
2.54%
1 ene 1993 año
16.733
+0.597
3.7%
1 ene 1994 año
16.974
+0.241
1.44%
1 ene 1995 año
17.35
+0.376
2.22%
1 ene 1996 año
17.474
+0.124
0.71%
1 ene 1997 año
17.719
+0.245
1.4%
1 ene 1998 año
18.361
+0.642
3.62%
1 ene 1999 año
19.252
+0.891
4.85%
1 ene 2000 año
19.653
+0.402
2.09%
1 ene 2001 año
19.399
-0.255
-1.3%
1 ene 2002 año
19.55
+0.151
0.78%
1 ene 2003 año
19.841
+0.291
1.49%
1 ene 2004 año
19.635
-0.206
-1.04%
1 ene 2005 año
20.278
+0.643
3.27%
1 ene 2006 año
20.393
+0.115
0.57%
1 ene 2007 año
20.474
+0.08
0.39%
1 ene 2008 año
20.938
+0.465
2.27%
1 ene 2009 año
20.953
+0.014
0.07%
1 ene 2010 año
21.714
+0.761
3.63%
1 ene 2011 año
21.025
-0.689
-3.17%
1 ene 2012 año
20.99
-0.034
-0.16%
1 ene 2013 año
20.656
-0.334
-1.59%
1 ene 2014 año
21.069
+0.413
2.0%
Ranking de los países por los datos estadísticos actuales


Comentarios: