29
/es/
es
AIzaSyAYiBZKx7MnpbEhh9jyipgxe19OcubqV5w
April 1, 2024
221936
Peru
PER
true
2
1
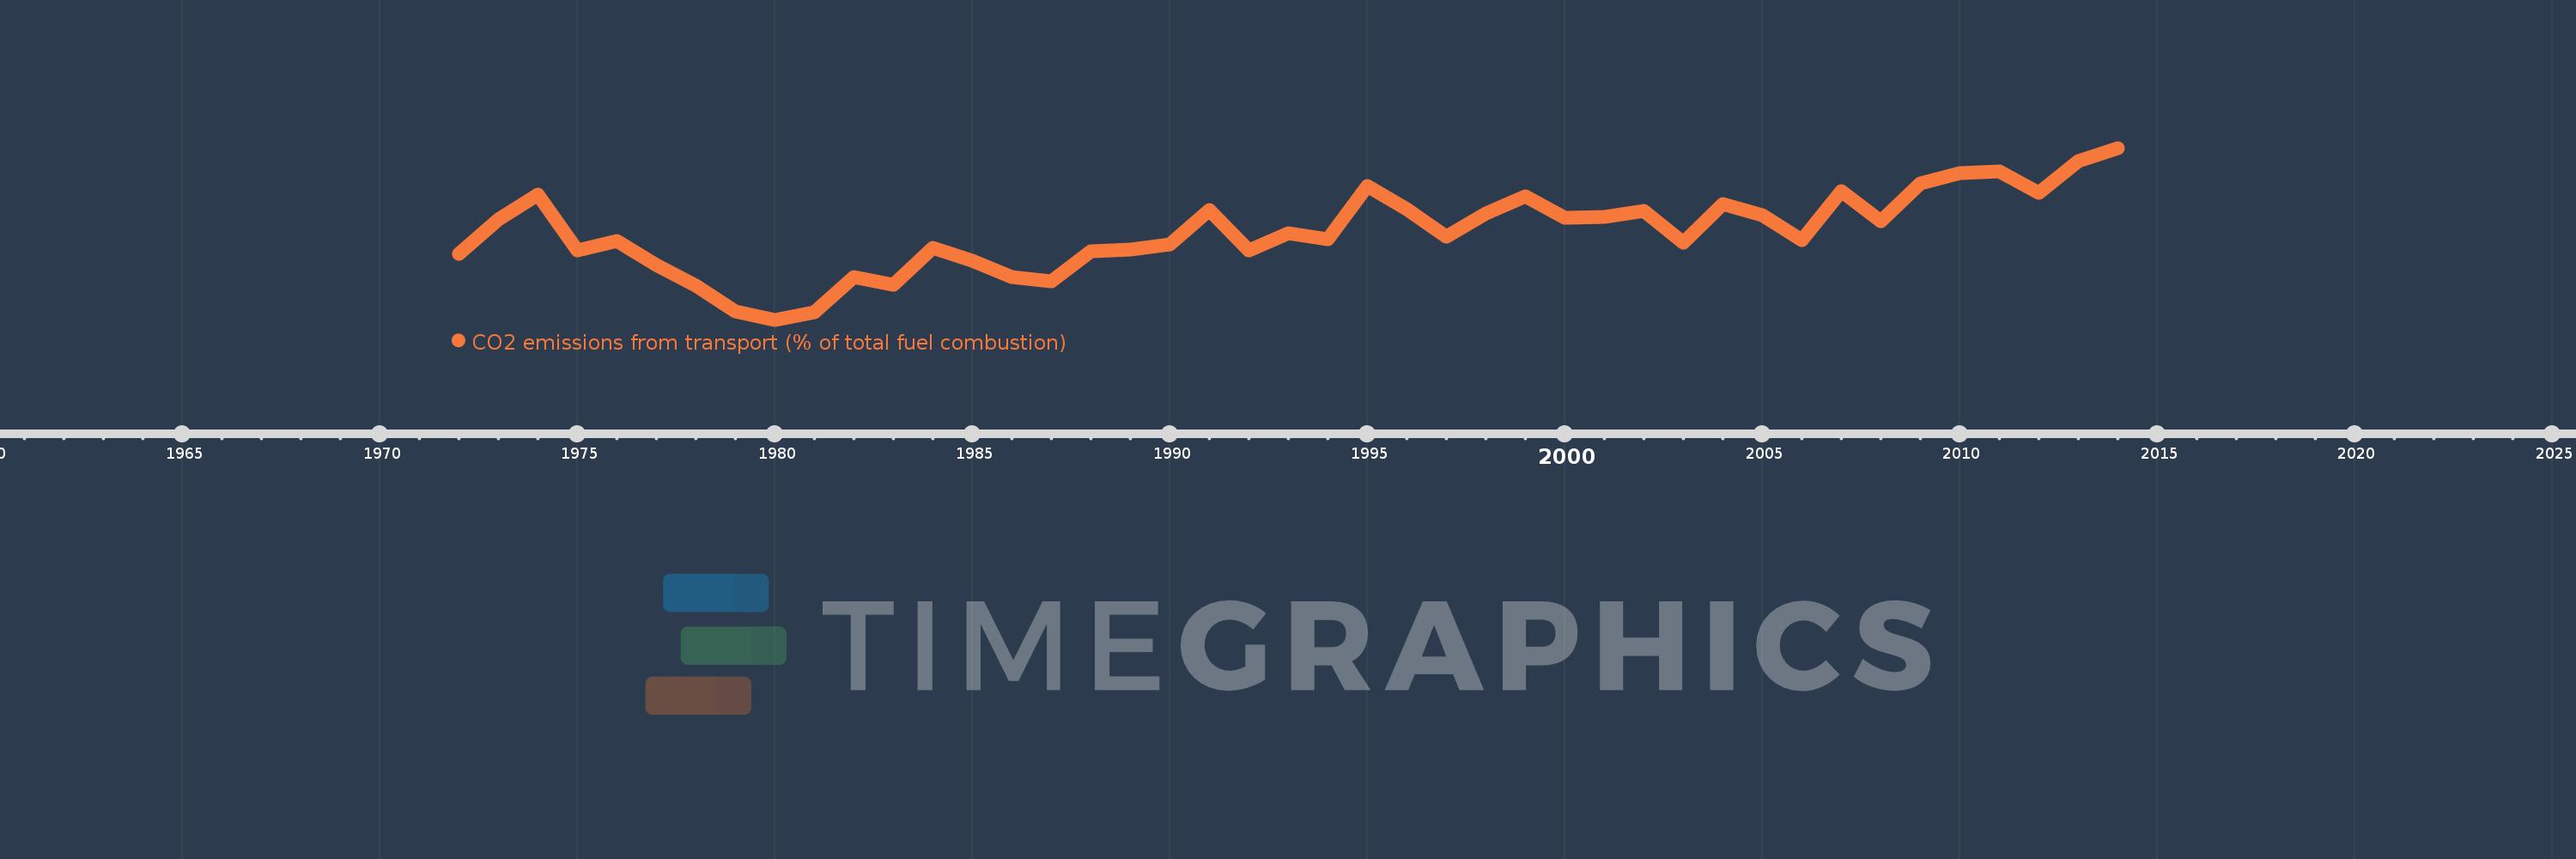
CO2 emissions from transport (% of total fuel combustion)
2014,2013,2012,2011,2010,2009,2008,2007,2006,2005,2004,2003,2002,2001,2000,1999,1998,1997,1996,1995,1994,1993,1992,1991,1990,1989,1988,1987,1986,1985,1984,1983,1982,1981,1980,1979,1978,1977,1976,1975,1974,1973,1972
Estas estadísticas en otros países:
AlbaniaAlgeriaAngolaArab WorldArgentinaArmeniaAustraliaAustriaAzerbaijanBahrainBangladeshBelarusBelgiumBeninBoliviaBosnia and HerzegovinaBotswanaBrazilBrunei DarussalamBulgariaCambodiaCameroonCanadaCaribbean small statesCentral Europe and the BalticsChileChinaColombiaCongo, Dem. Rep.Congo, Rep.Costa RicaCote d'IvoireCroatiaCubaCuracaoCyprusCzech RepublicDenmarkDominican RepublicEarly-demographic dividendEast Asia & PacificEast Asia & Pacific (excluding high income)East Asia & Pacific (IDA & IBRD countries)EcuadorEgypt, Arab Rep.El SalvadorEritreaEstoniaEthiopiaEuro areaEurope & Central AsiaEurope & Central Asia (excluding high income)Europe & Central Asia (IDA & IBRD countries)European UnionFinlandFragile and conflict affected situationsFranceGabonGeorgiaGermanyGhanaGibraltarGreeceGuatemalaHaitiHeavily indebted poor countries (HIPC)High incomeHondurasHong Kong SAR, ChinaHungaryIBRD onlyIcelandIDA & IBRD totalIDA blendIDA onlyIDA totalIndiaIndonesiaIran, Islamic Rep.IraqIrelandIsraelItalyJamaicaJapanJordanKazakhstanKenyaKorea, Dem. People’s Rep.Korea, Rep.KosovoKuwaitKyrgyz RepublicLate-demographic dividendLatin America & Caribbean Latin America & Caribbean (excluding high income)Latin America & the Caribbean (IDA & IBRD countries)LatviaLeast developed countries: UN classificationLebanonLibyaLithuaniaLow & middle incomeLow incomeLower middle incomeLuxembourgMacedonia, FYRMalaysiaMaltaMauritiusMexicoMiddle East & North AfricaMiddle East & North Africa (excluding high income)Middle East & North Africa (IDA & IBRD countries)Middle incomeMoldovaMongoliaMontenegroMoroccoMozambiqueMyanmarNamibiaNepalNetherlandsNew ZealandNicaraguaNigerNigeriaNorth AmericaNorwayOECD membersOmanOther small statesPakistanPanamaParaguayPeruPhilippinesPolandPortugalPost-demographic dividendPre-demographic dividendQatarRomaniaRussian FederationSaudi ArabiaSenegalSerbiaSingaporeSlovak RepublicSloveniaSmall statesSouth AfricaSouth AsiaSouth Asia (IDA & IBRD)South SudanSpainSri LankaSub-Saharan Africa Sub-Saharan Africa (excluding high income)Sub-Saharan Africa (IDA & IBRD countries)SudanSwedenSwitzerlandSyrian Arab RepublicTajikistanTanzaniaThailandTogoTrinidad and TobagoTunisiaTurkeyTurkmenistanUkraineUnited Arab EmiratesUnited KingdomUnited StatesUpper middle incomeUruguayUzbekistanVenezuela, RBVietnamWorldYemen, Rep.ZambiaZimbabwe línea de tiempo (timeline):
En esta escala de tiempo se presenta un gráfico de 1972 y 2014 de Peru. Los datos de 1971 están ausentes. El número de observaciones reales por fecha: 43.
Fuente (nombre):
Indicadores del desarrollo mundial
Fuente (organización):
IEA Statistics © OECD/IEA 2014 (http://www.iea.org/stats/index.asp), subject to https://www.iea.org/t&c/termsandconditions/
Categorías:
Environment
Se ha actualizado:
23 abr 2017 año
Los indicadores de los cambios de valor en los últimos años
Mínimo:
29.547
1 ene 1980 año
Máximo:
41.652
1 ene 2014 año
A la fecha de observación
Valor
Cambio absoluto
El cambio con respecto al valor anterior
1 ene 1972 año
34.2
+34.2
0.0%
1 ene 1973 año
36.623
+2.423
7.09%
1 ene 1974 año
38.338
+1.715
4.68%
1 ene 1975 año
34.439
-3.899
-10.17%
1 ene 1976 año
35.107
+0.668
1.94%
1 ene 1977 año
33.387
-1.72
-4.9%
1 ene 1978 año
31.958
-1.429
-4.28%
1 ene 1979 año
30.136
-1.822
-5.7%
1 ene 1980 año
29.547
-0.59
-1.96%
1 ene 1981 año
30.064
+0.517
1.75%
1 ene 1982 año
32.533
+2.469
8.21%
1 ene 1983 año
32.004
-0.529
-1.63%
1 ene 1984 año
34.609
+2.605
8.14%
1 ene 1985 año
33.728
-0.881
-2.55%
1 ene 1986 año
32.576
-1.152
-3.41%
1 ene 1987 año
32.246
-0.33
-1.01%
1 ene 1988 año
34.371
+2.124
6.59%
1 ene 1989 año
34.478
+0.107
0.31%
1 ene 1990 año
34.87
+0.393
1.14%
1 ene 1991 año
37.304
+2.434
6.98%
1 ene 1992 año
34.431
-2.873
-7.7%
1 ene 1993 año
35.659
+1.228
3.57%
1 ene 1994 año
35.215
-0.444
-1.25%
1 ene 1995 año
38.948
+3.734
10.6%
1 ene 1996 año
37.339
-1.609
-4.13%
1 ene 1997 año
35.411
-1.928
-5.16%
1 ene 1998 año
37.008
+1.597
4.51%
1 ene 1999 año
38.263
+1.255
3.39%
1 ene 2000 año
36.76
-1.503
-3.93%
1 ene 2001 año
36.794
+0.034
0.09%
1 ene 2002 año
37.197
+0.403
1.09%
1 ene 2003 año
34.953
-2.244
-6.03%
1 ene 2004 año
37.676
+2.723
7.79%
1 ene 2005 año
36.892
-0.784
-2.08%
1 ene 2006 año
35.185
-1.706
-4.63%
1 ene 2007 año
38.615
+3.43
9.75%
1 ene 2008 año
36.493
-2.122
-5.5%
1 ene 2009 año
39.176
+2.683
7.35%
1 ene 2010 año
39.851
+0.675
1.72%
1 ene 2011 año
39.985
+0.134
0.34%
1 ene 2012 año
38.467
-1.519
-3.8%
1 ene 2013 año
40.727
+2.261
5.88%
1 ene 2014 año
41.652
+0.925
2.27%
Ranking de los países por los datos estadísticos actuales


Comentarios: