29
/es/
es
AIzaSyAYiBZKx7MnpbEhh9jyipgxe19OcubqV5w
April 1, 2024
141616
Greece
GRC
true
2
1
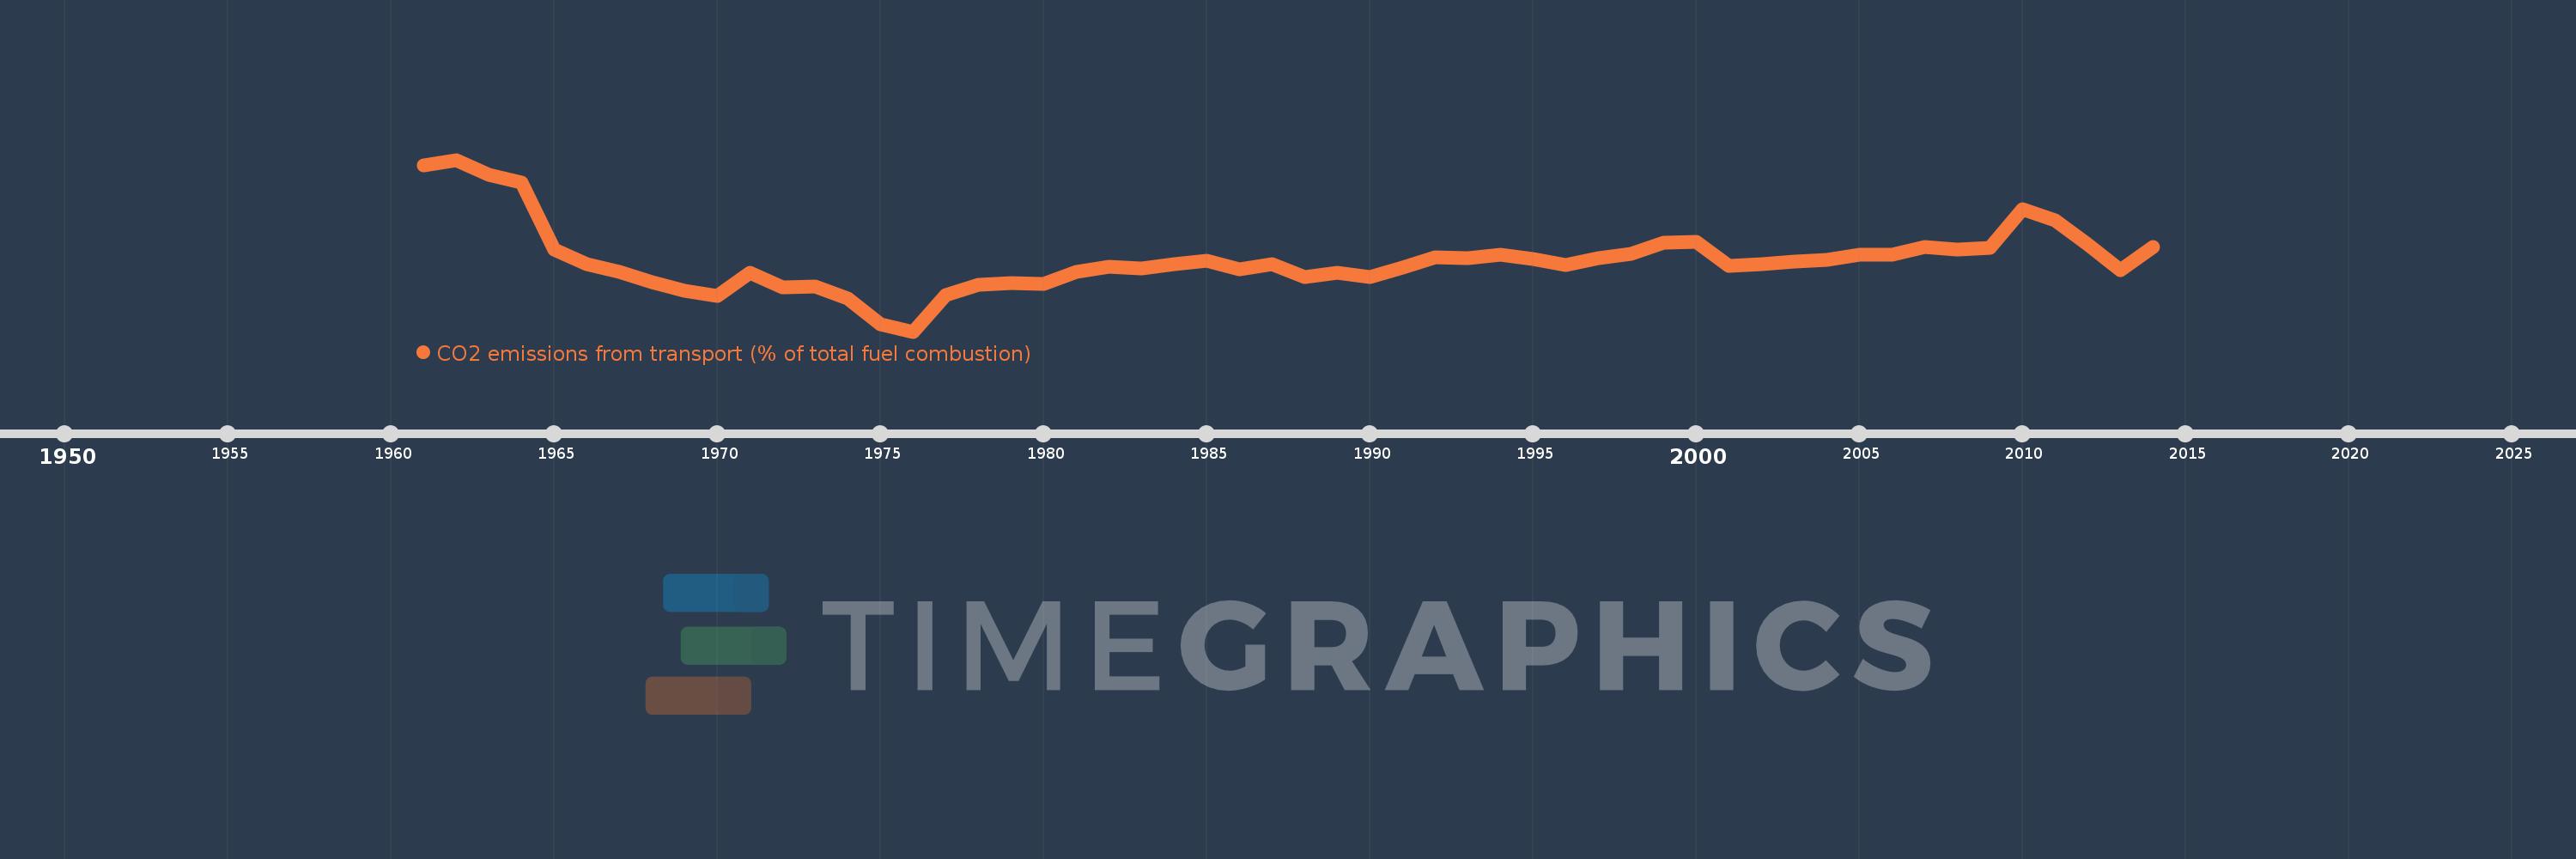
CO2 emissions from transport (% of total fuel combustion)
2014,2013,2012,2011,2010,2009,2008,2007,2006,2005,2004,2003,2002,2001,2000,1999,1998,1997,1996,1995,1994,1993,1992,1991,1990,1989,1988,1987,1986,1985,1984,1983,1982,1981,1980,1979,1978,1977,1976,1975,1974,1973,1972,1971,1970,1969,1968,1967,1966,1965,1964,1963,1962,1961
Estas estadísticas en otros países:
AlbaniaAlgeriaAngolaArab WorldArgentinaArmeniaAustraliaAustriaAzerbaijanBahrainBangladeshBelarusBelgiumBeninBoliviaBosnia and HerzegovinaBotswanaBrazilBrunei DarussalamBulgariaCambodiaCameroonCanadaCaribbean small statesCentral Europe and the BalticsChileChinaColombiaCongo, Dem. Rep.Congo, Rep.Costa RicaCote d'IvoireCroatiaCubaCuracaoCyprusCzech RepublicDenmarkDominican RepublicEarly-demographic dividendEast Asia & PacificEast Asia & Pacific (excluding high income)East Asia & Pacific (IDA & IBRD countries)EcuadorEgypt, Arab Rep.El SalvadorEritreaEstoniaEthiopiaEuro areaEurope & Central AsiaEurope & Central Asia (excluding high income)Europe & Central Asia (IDA & IBRD countries)European UnionFinlandFragile and conflict affected situationsFranceGabonGeorgiaGermanyGhanaGibraltarGreeceGuatemalaHaitiHeavily indebted poor countries (HIPC)High incomeHondurasHong Kong SAR, ChinaHungaryIBRD onlyIcelandIDA & IBRD totalIDA blendIDA onlyIDA totalIndiaIndonesiaIran, Islamic Rep.IraqIrelandIsraelItalyJamaicaJapanJordanKazakhstanKenyaKorea, Dem. People’s Rep.Korea, Rep.KosovoKuwaitKyrgyz RepublicLate-demographic dividendLatin America & Caribbean Latin America & Caribbean (excluding high income)Latin America & the Caribbean (IDA & IBRD countries)LatviaLeast developed countries: UN classificationLebanonLibyaLithuaniaLow & middle incomeLow incomeLower middle incomeLuxembourgMacedonia, FYRMalaysiaMaltaMauritiusMexicoMiddle East & North AfricaMiddle East & North Africa (excluding high income)Middle East & North Africa (IDA & IBRD countries)Middle incomeMoldovaMongoliaMontenegroMoroccoMozambiqueMyanmarNamibiaNepalNetherlandsNew ZealandNicaraguaNigerNigeriaNorth AmericaNorwayOECD membersOmanOther small statesPakistanPanamaParaguayPeruPhilippinesPolandPortugalPost-demographic dividendPre-demographic dividendQatarRomaniaRussian FederationSaudi ArabiaSenegalSerbiaSingaporeSlovak RepublicSloveniaSmall statesSouth AfricaSouth AsiaSouth Asia (IDA & IBRD)South SudanSpainSri LankaSub-Saharan Africa Sub-Saharan Africa (excluding high income)Sub-Saharan Africa (IDA & IBRD countries)SudanSwedenSwitzerlandSyrian Arab RepublicTajikistanTanzaniaThailandTogoTrinidad and TobagoTunisiaTurkeyTurkmenistanUkraineUnited Arab EmiratesUnited KingdomUnited StatesUpper middle incomeUruguayUzbekistanVenezuela, RBVietnamWorldYemen, Rep.ZambiaZimbabwe línea de tiempo (timeline):
En esta escala de tiempo se presenta un gráfico de 1961 y 2014 de Greece. Los datos de 1960 están ausentes. El número de observaciones reales por fecha: 54.
Fuente (nombre):
Indicadores del desarrollo mundial
Fuente (organización):
IEA Statistics © OECD/IEA 2014 (http://www.iea.org/stats/index.asp), subject to https://www.iea.org/t&c/termsandconditions/
Categorías:
Environment
Se ha actualizado:
23 abr 2017 año
Los indicadores de los cambios de valor en los últimos años
Mínimo:
15.044
1 ene 1976 año
Máximo:
32.491
1 ene 1962 año
A la fecha de observación
Valor
Cambio absoluto
El cambio con respecto al valor anterior
1 ene 1961 año
31.967
+31.967
0.0%
1 ene 1962 año
32.491
+0.524
1.64%
1 ene 1963 año
30.958
-1.533
-4.72%
1 ene 1964 año
30.218
-0.74
-2.39%
1 ene 1965 año
23.354
-6.864
-22.72%
1 ene 1966 año
21.882
-1.471
-6.3%
1 ene 1967 año
21.144
-0.738
-3.37%
1 ene 1968 año
20.101
-1.044
-4.94%
1 ene 1969 año
19.159
-0.942
-4.69%
1 ene 1970 año
18.636
-0.523
-2.73%
1 ene 1971 año
21.008
+2.372
12.73%
1 ene 1972 año
19.513
-1.495
-7.12%
1 ene 1973 año
19.627
+0.114
0.58%
1 ene 1974 año
18.387
-1.24
-6.32%
1 ene 1975 año
15.747
-2.64
-14.36%
1 ene 1976 año
15.044
-0.703
-4.46%
1 ene 1977 año
18.748
+3.704
24.62%
1 ene 1978 año
19.801
+1.053
5.61%
1 ene 1979 año
19.972
+0.171
0.86%
1 ene 1980 año
19.849
-0.123
-0.62%
1 ene 1981 año
21.133
+1.284
6.47%
1 ene 1982 año
21.603
+0.47
2.22%
1 ene 1983 año
21.432
-0.171
-0.79%
1 ene 1984 año
21.913
+0.481
2.24%
1 ene 1985 año
22.242
+0.329
1.5%
1 ene 1986 año
21.409
-0.833
-3.75%
1 ene 1987 año
21.901
+0.493
2.3%
1 ene 1988 año
20.551
-1.35
-6.16%
1 ene 1989 año
21.018
+0.467
2.27%
1 ene 1990 año
20.625
-0.393
-1.87%
1 ene 1991 año
21.545
+0.92
4.46%
1 ene 1992 año
22.623
+1.078
5.0%
1 ene 1993 año
22.499
-0.124
-0.55%
1 ene 1994 año
22.82
+0.322
1.43%
1 ene 1995 año
22.445
-0.376
-1.65%
1 ene 1996 año
21.835
-0.61
-2.72%
1 ene 1997 año
22.478
+0.644
2.95%
1 ene 1998 año
22.959
+0.481
2.14%
1 ene 1999 año
24.038
+1.079
4.7%
1 ene 2000 año
24.174
+0.136
0.57%
1 ene 2001 año
21.675
-2.498
-10.33%
1 ene 2002 año
21.931
+0.256
1.18%
1 ene 2003 año
22.172
+0.241
1.1%
1 ene 2004 año
22.343
+0.171
0.77%
1 ene 2005 año
22.867
+0.524
2.35%
1 ene 2006 año
22.876
+0.009
0.04%
1 ene 2007 año
23.664
+0.789
3.45%
1 ene 2008 año
23.346
-0.318
-1.34%
1 ene 2009 año
23.506
+0.16
0.69%
1 ene 2010 año
27.48
+3.974
16.91%
1 ene 2011 año
26.349
-1.132
-4.12%
1 ene 2012 año
23.902
-2.447
-9.29%
1 ene 2013 año
21.292
-2.609
-10.92%
1 ene 2014 año
23.661
+2.369
11.12%
Ranking de los países por los datos estadísticos actuales


Comentarios: