29
/es/
es
AIzaSyAYiBZKx7MnpbEhh9jyipgxe19OcubqV5w
April 1, 2024
150105
Honduras
HND
true
2
1
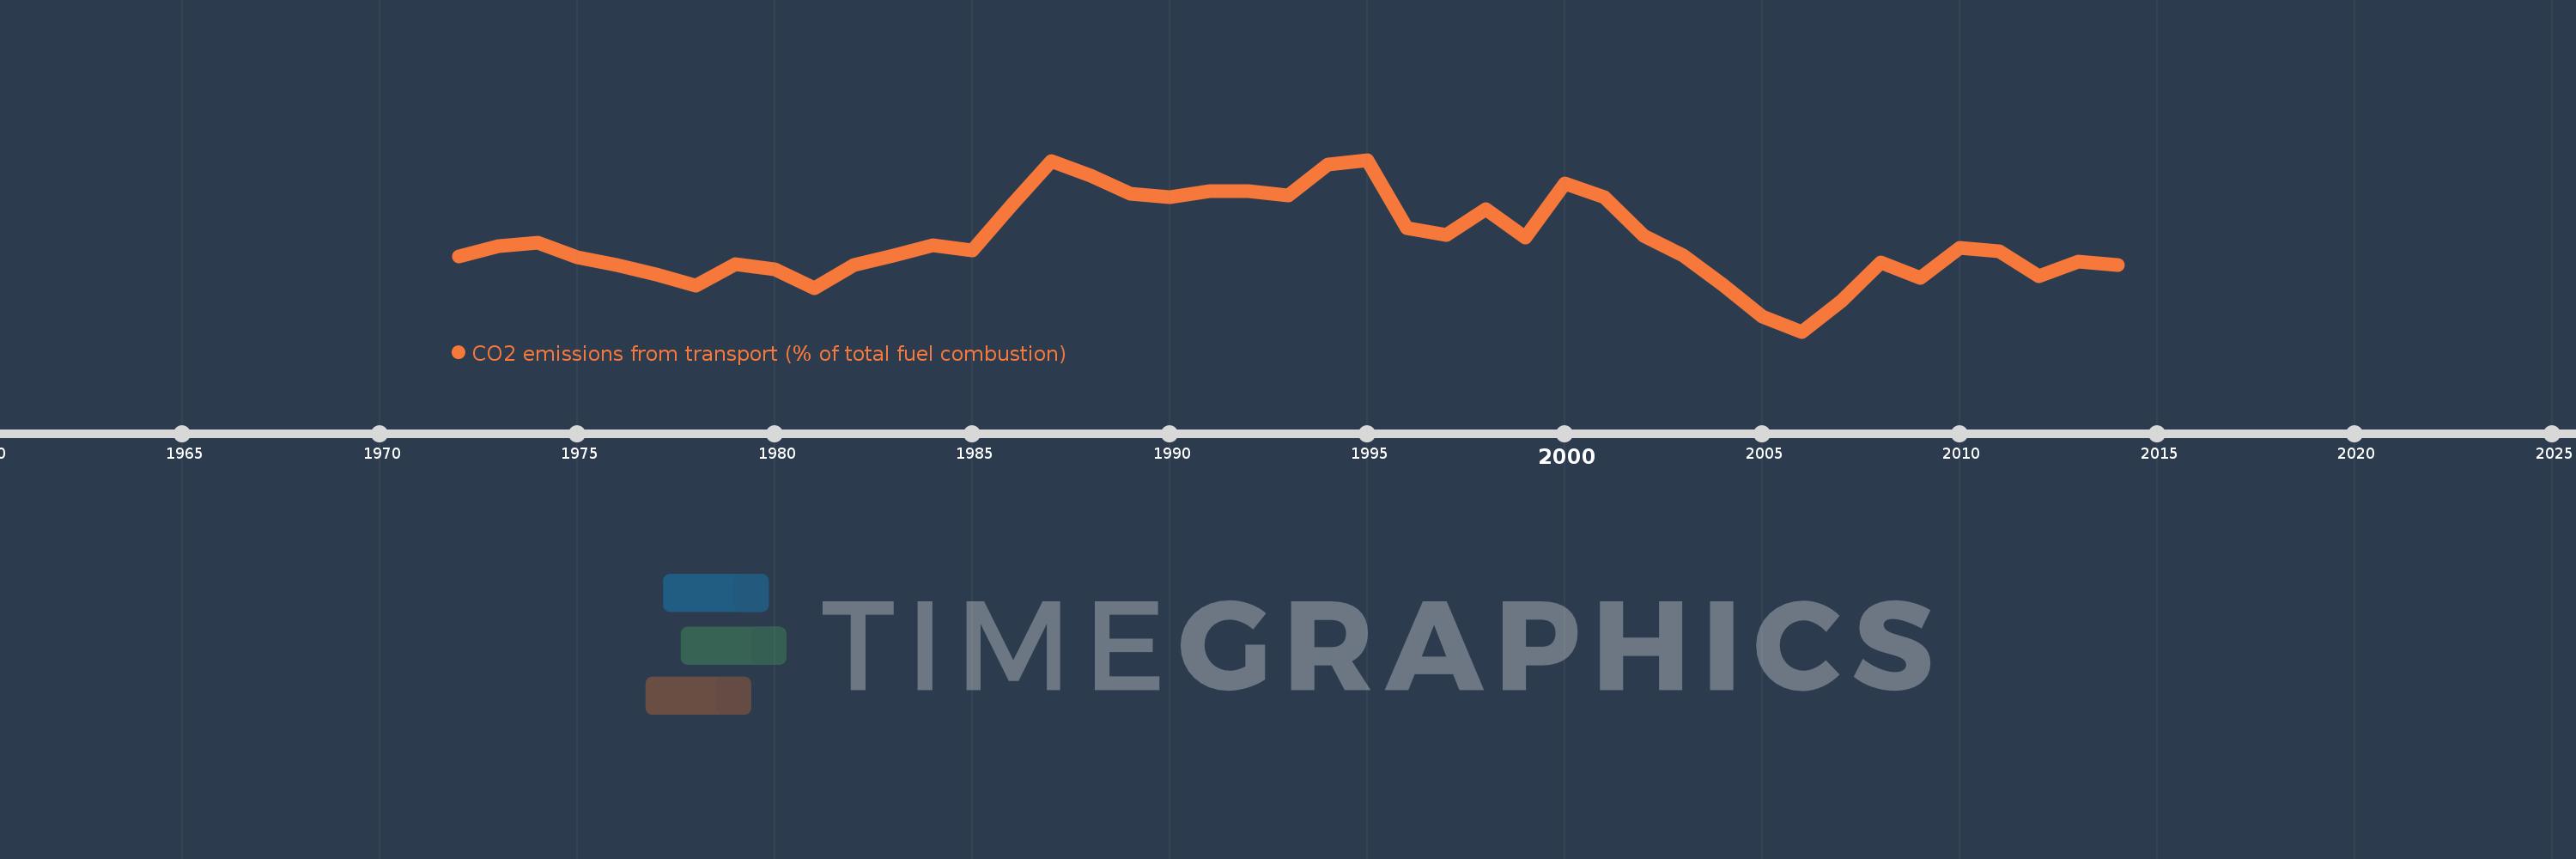
CO2 emissions from transport (% of total fuel combustion)
2014,2013,2012,2011,2010,2009,2008,2007,2006,2005,2004,2003,2002,2001,2000,1999,1998,1997,1996,1995,1994,1993,1992,1991,1990,1989,1988,1987,1986,1985,1984,1983,1982,1981,1980,1979,1978,1977,1976,1975,1974,1973,1972
Estas estadísticas en otros países:
AlbaniaAlgeriaAngolaArab WorldArgentinaArmeniaAustraliaAustriaAzerbaijanBahrainBangladeshBelarusBelgiumBeninBoliviaBosnia and HerzegovinaBotswanaBrazilBrunei DarussalamBulgariaCambodiaCameroonCanadaCaribbean small statesCentral Europe and the BalticsChileChinaColombiaCongo, Dem. Rep.Congo, Rep.Costa RicaCote d'IvoireCroatiaCubaCuracaoCyprusCzech RepublicDenmarkDominican RepublicEarly-demographic dividendEast Asia & PacificEast Asia & Pacific (excluding high income)East Asia & Pacific (IDA & IBRD countries)EcuadorEgypt, Arab Rep.El SalvadorEritreaEstoniaEthiopiaEuro areaEurope & Central AsiaEurope & Central Asia (excluding high income)Europe & Central Asia (IDA & IBRD countries)European UnionFinlandFragile and conflict affected situationsFranceGabonGeorgiaGermanyGhanaGibraltarGreeceGuatemalaHaitiHeavily indebted poor countries (HIPC)High incomeHondurasHong Kong SAR, ChinaHungaryIBRD onlyIcelandIDA & IBRD totalIDA blendIDA onlyIDA totalIndiaIndonesiaIran, Islamic Rep.IraqIrelandIsraelItalyJamaicaJapanJordanKazakhstanKenyaKorea, Dem. People’s Rep.Korea, Rep.KosovoKuwaitKyrgyz RepublicLate-demographic dividendLatin America & Caribbean Latin America & Caribbean (excluding high income)Latin America & the Caribbean (IDA & IBRD countries)LatviaLeast developed countries: UN classificationLebanonLibyaLithuaniaLow & middle incomeLow incomeLower middle incomeLuxembourgMacedonia, FYRMalaysiaMaltaMauritiusMexicoMiddle East & North AfricaMiddle East & North Africa (excluding high income)Middle East & North Africa (IDA & IBRD countries)Middle incomeMoldovaMongoliaMontenegroMoroccoMozambiqueMyanmarNamibiaNepalNetherlandsNew ZealandNicaraguaNigerNigeriaNorth AmericaNorwayOECD membersOmanOther small statesPakistanPanamaParaguayPeruPhilippinesPolandPortugalPost-demographic dividendPre-demographic dividendQatarRomaniaRussian FederationSaudi ArabiaSenegalSerbiaSingaporeSlovak RepublicSloveniaSmall statesSouth AfricaSouth AsiaSouth Asia (IDA & IBRD)South SudanSpainSri LankaSub-Saharan Africa Sub-Saharan Africa (excluding high income)Sub-Saharan Africa (IDA & IBRD countries)SudanSwedenSwitzerlandSyrian Arab RepublicTajikistanTanzaniaThailandTogoTrinidad and TobagoTunisiaTurkeyTurkmenistanUkraineUnited Arab EmiratesUnited KingdomUnited StatesUpper middle incomeUruguayUzbekistanVenezuela, RBVietnamWorldYemen, Rep.ZambiaZimbabwe línea de tiempo (timeline):
En esta escala de tiempo se presenta un gráfico de 1972 y 2014 de Honduras. Los datos de 1971 están ausentes. El número de observaciones reales por fecha: 43.
Fuente (nombre):
Indicadores del desarrollo mundial
Fuente (organización):
IEA Statistics © OECD/IEA 2014 (http://www.iea.org/stats/index.asp), subject to https://www.iea.org/t&c/termsandconditions/
Categorías:
Environment
Se ha actualizado:
23 abr 2017 año
Los indicadores de los cambios de valor en los últimos años
Mínimo:
31.425
1 ene 2006 año
Máximo:
51.333
1 ene 1995 año
A la fecha de observación
Valor
Cambio absoluto
El cambio con respecto al valor anterior
1 ene 1972 año
40.179
+40.179
0.0%
1 ene 1973 año
41.379
+1.201
2.99%
1 ene 1974 año
41.732
+0.353
0.85%
1 ene 1975 año
40.0
-1.732
-4.15%
1 ene 1976 año
39.098
-0.902
-2.26%
1 ene 1977 año
38.028
-1.07
-2.74%
1 ene 1978 año
36.709
-1.319
-3.47%
1 ene 1979 año
39.241
+2.532
6.9%
1 ene 1980 año
38.69
-0.55
-1.4%
1 ene 1981 año
36.471
-2.22
-5.74%
1 ene 1982 año
39.13
+2.66
7.29%
1 ene 1983 año
40.252
+1.121
2.87%
1 ene 1984 año
41.477
+1.226
3.05%
1 ene 1985 año
40.86
-0.617
-1.49%
1 ene 1986 año
46.108
+5.248
12.84%
1 ene 1987 año
51.176
+5.069
10.99%
1 ene 1988 año
49.474
-1.703
-3.33%
1 ene 1989 año
47.368
-2.105
-4.26%
1 ene 1990 año
46.983
-0.386
-0.81%
1 ene 1991 año
47.706
+0.724
1.54%
1 ene 1992 año
47.685
-0.021
-0.04%
1 ene 1993 año
47.154
-0.531
-1.11%
1 ene 1994 año
50.769
+3.615
7.67%
1 ene 1995 año
51.333
+0.564
1.11%
1 ene 1996 año
43.417
-7.916
-15.42%
1 ene 1997 año
42.614
-0.804
-1.85%
1 ene 1998 año
45.58
+2.966
6.96%
1 ene 1999 año
42.361
-3.219
-7.06%
1 ene 2000 año
48.624
+6.263
14.78%
1 ene 2001 año
46.993
-1.631
-3.35%
1 ene 2002 año
42.533
-4.46
-9.49%
1 ene 2003 año
40.214
-2.32
-5.45%
1 ene 2004 año
36.859
-3.355
-8.34%
1 ene 2005 año
33.144
-3.715
-10.08%
1 ene 2006 año
31.425
-1.719
-5.19%
1 ene 2007 año
35.0
+3.575
11.38%
1 ene 2008 año
39.409
+4.409
12.6%
1 ene 2009 año
37.69
-1.719
-4.36%
1 ene 2010 año
41.081
+3.391
9.0%
1 ene 2011 año
40.736
-0.345
-0.84%
1 ene 2012 año
37.828
-2.908
-7.14%
1 ene 2013 año
39.521
+1.693
4.47%
1 ene 2014 año
39.172
-0.349
-0.88%
Ranking de los países por los datos estadísticos actuales


Comentarios: