29
/es/
es
AIzaSyAYiBZKx7MnpbEhh9jyipgxe19OcubqV5w
April 1, 2024
23959
Arab World
ARB
false
2
1
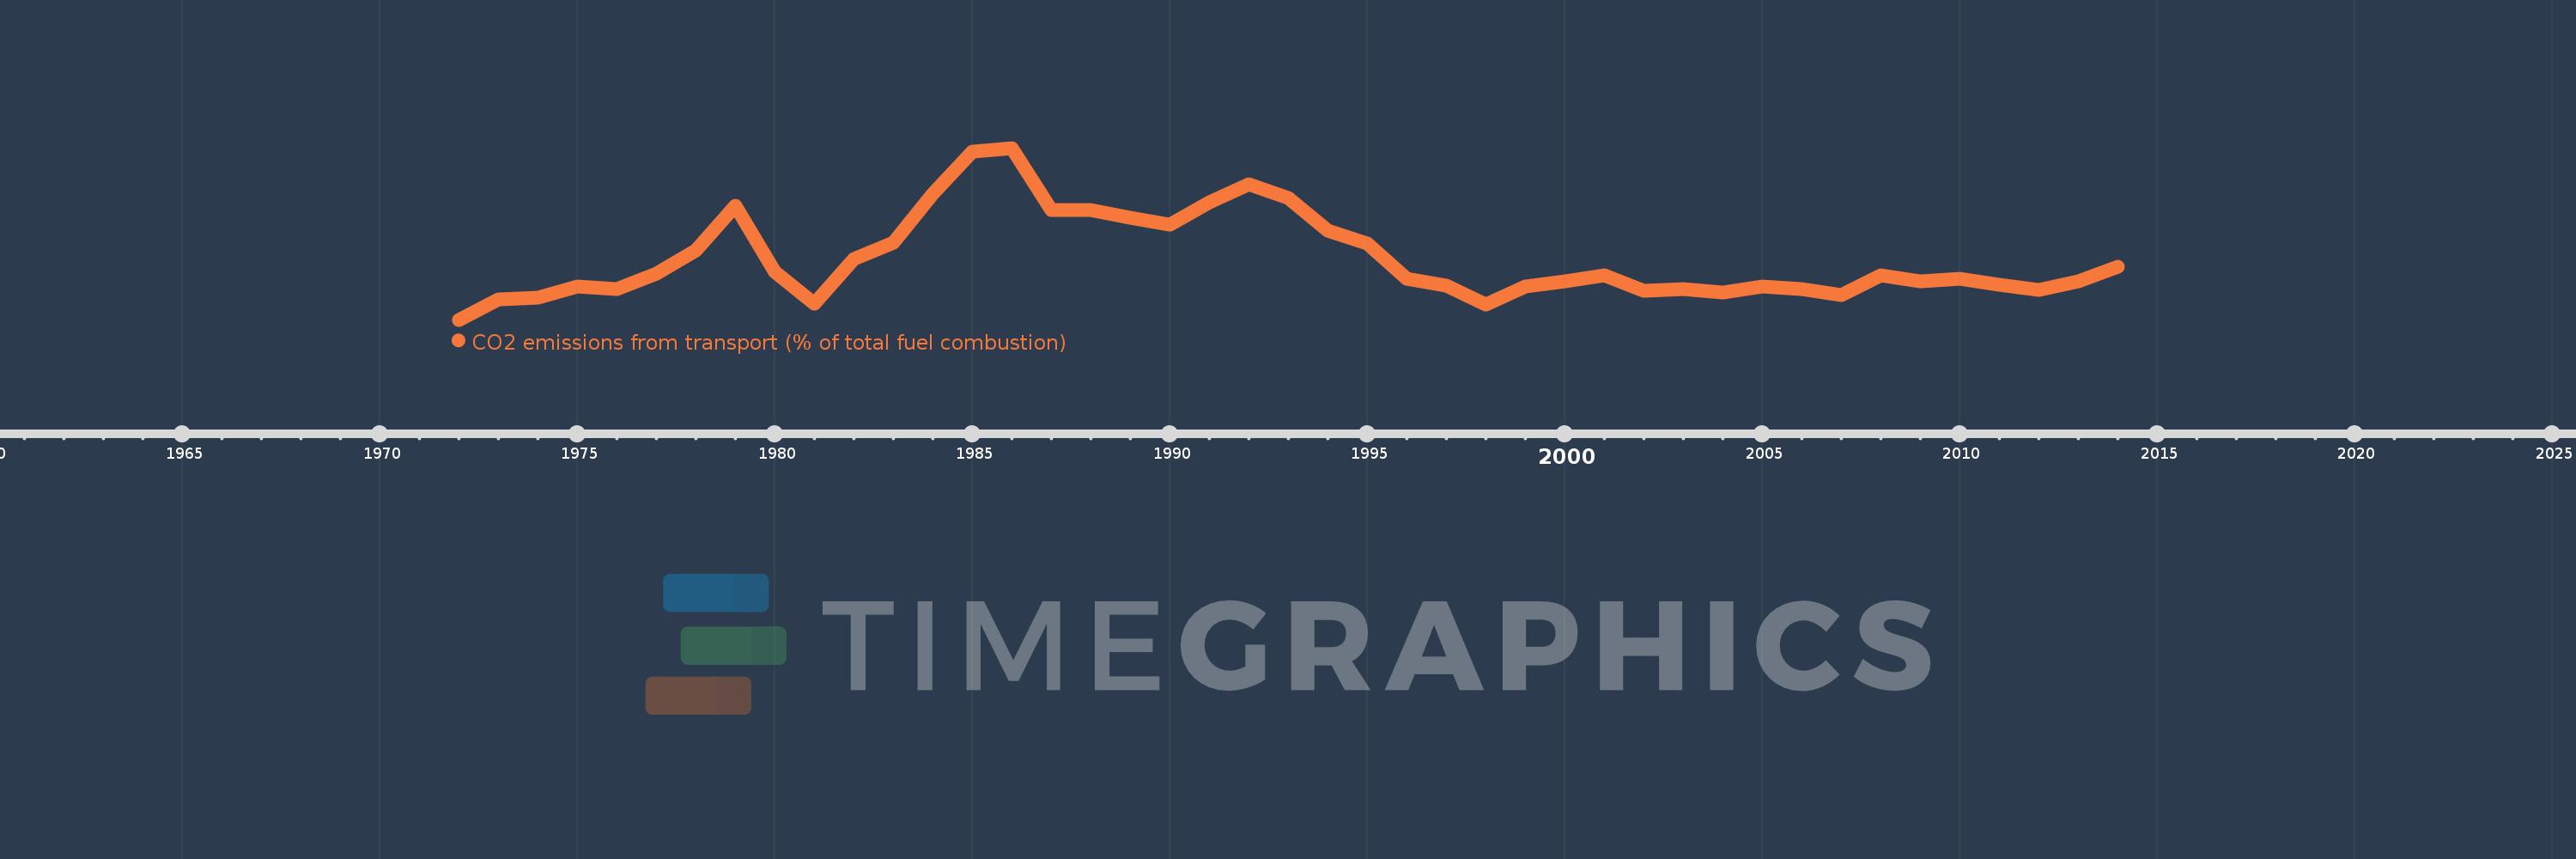
CO2 emissions from transport (% of total fuel combustion)
2014,2013,2012,2011,2010,2009,2008,2007,2006,2005,2004,2003,2002,2001,2000,1999,1998,1997,1996,1995,1994,1993,1992,1991,1990,1989,1988,1987,1986,1985,1984,1983,1982,1981,1980,1979,1978,1977,1976,1975,1974,1973,1972
Estas estadísticas en otros países:
AlbaniaAlgeriaAngolaArab WorldArgentinaArmeniaAustraliaAustriaAzerbaijanBahrainBangladeshBelarusBelgiumBeninBoliviaBosnia and HerzegovinaBotswanaBrazilBrunei DarussalamBulgariaCambodiaCameroonCanadaCaribbean small statesCentral Europe and the BalticsChileChinaColombiaCongo, Dem. Rep.Congo, Rep.Costa RicaCote d'IvoireCroatiaCubaCuracaoCyprusCzech RepublicDenmarkDominican RepublicEarly-demographic dividendEast Asia & PacificEast Asia & Pacific (excluding high income)East Asia & Pacific (IDA & IBRD countries)EcuadorEgypt, Arab Rep.El SalvadorEritreaEstoniaEthiopiaEuro areaEurope & Central AsiaEurope & Central Asia (excluding high income)Europe & Central Asia (IDA & IBRD countries)European UnionFinlandFragile and conflict affected situationsFranceGabonGeorgiaGermanyGhanaGibraltarGreeceGuatemalaHaitiHeavily indebted poor countries (HIPC)High incomeHondurasHong Kong SAR, ChinaHungaryIBRD onlyIcelandIDA & IBRD totalIDA blendIDA onlyIDA totalIndiaIndonesiaIran, Islamic Rep.IraqIrelandIsraelItalyJamaicaJapanJordanKazakhstanKenyaKorea, Dem. People’s Rep.Korea, Rep.KosovoKuwaitKyrgyz RepublicLate-demographic dividendLatin America & Caribbean Latin America & Caribbean (excluding high income)Latin America & the Caribbean (IDA & IBRD countries)LatviaLeast developed countries: UN classificationLebanonLibyaLithuaniaLow & middle incomeLow incomeLower middle incomeLuxembourgMacedonia, FYRMalaysiaMaltaMauritiusMexicoMiddle East & North AfricaMiddle East & North Africa (excluding high income)Middle East & North Africa (IDA & IBRD countries)Middle incomeMoldovaMongoliaMontenegroMoroccoMozambiqueMyanmarNamibiaNepalNetherlandsNew ZealandNicaraguaNigerNigeriaNorth AmericaNorwayOECD membersOmanOther small statesPakistanPanamaParaguayPeruPhilippinesPolandPortugalPost-demographic dividendPre-demographic dividendQatarRomaniaRussian FederationSaudi ArabiaSenegalSerbiaSingaporeSlovak RepublicSloveniaSmall statesSouth AfricaSouth AsiaSouth Asia (IDA & IBRD)South SudanSpainSri LankaSub-Saharan Africa Sub-Saharan Africa (excluding high income)Sub-Saharan Africa (IDA & IBRD countries)SudanSwedenSwitzerlandSyrian Arab RepublicTajikistanTanzaniaThailandTogoTrinidad and TobagoTunisiaTurkeyTurkmenistanUkraineUnited Arab EmiratesUnited KingdomUnited StatesUpper middle incomeUruguayUzbekistanVenezuela, RBVietnamWorldYemen, Rep.ZambiaZimbabwe línea de tiempo (timeline):
En esta escala de tiempo se presenta un gráfico de 1972 y 2014 de Arab World. Los datos de 1971 están ausentes. El número de observaciones reales por fecha: 43.
Fuente (nombre):
Indicadores del desarrollo mundial
Fuente (organización):
IEA Statistics © OECD/IEA 2014 (http://www.iea.org/stats/index.asp), subject to https://www.iea.org/t&c/termsandconditions/
Categorías:
Environment
Se ha actualizado:
23 abr 2017 año
Los indicadores de los cambios de valor en los últimos años
Mínimo:
23.732
1 ene 1972 año
Máximo:
29.301
1 ene 1986 año
A la fecha de observación
Valor
Cambio absoluto
El cambio con respecto al valor anterior
1 ene 1972 año
23.732
+23.732
0.0%
1 ene 1973 año
24.389
+0.657
2.77%
1 ene 1974 año
24.438
+0.049
0.2%
1 ene 1975 año
24.821
+0.383
1.57%
1 ene 1976 año
24.713
-0.108
-0.43%
1 ene 1977 año
25.24
+0.528
2.14%
1 ene 1978 año
25.993
+0.753
2.98%
1 ene 1979 año
27.416
+1.422
5.47%
1 ene 1980 año
25.286
-2.129
-7.77%
1 ene 1981 año
24.251
-1.036
-4.1%
1 ene 1982 año
25.703
+1.452
5.99%
1 ene 1983 año
26.23
+0.527
2.05%
1 ene 1984 año
27.828
+1.598
6.09%
1 ene 1985 año
29.187
+1.36
4.89%
1 ene 1986 año
29.301
+0.114
0.39%
1 ene 1987 año
27.299
-2.003
-6.83%
1 ene 1988 año
27.286
-0.013
-0.05%
1 ene 1989 año
27.048
-0.238
-0.87%
1 ene 1990 año
26.803
-0.246
-0.91%
1 ene 1991 año
27.546
+0.744
2.78%
1 ene 1992 año
28.127
+0.581
2.11%
1 ene 1993 año
27.691
-0.437
-1.55%
1 ene 1994 año
26.628
-1.062
-3.84%
1 ene 1995 año
26.213
-0.415
-1.56%
1 ene 1996 año
25.073
-1.141
-4.35%
1 ene 1997 año
24.827
-0.246
-0.98%
1 ene 1998 año
24.216
-0.611
-2.46%
1 ene 1999 año
24.802
+0.587
2.42%
1 ene 2000 año
24.983
+0.18
0.73%
1 ene 2001 año
25.169
+0.187
0.75%
1 ene 2002 año
24.68
-0.489
-1.94%
1 ene 2003 año
24.713
+0.033
0.13%
1 ene 2004 año
24.621
-0.092
-0.37%
1 ene 2005 año
24.815
+0.194
0.79%
1 ene 2006 año
24.736
-0.079
-0.32%
1 ene 2007 año
24.528
-0.208
-0.84%
1 ene 2008 año
25.167
+0.639
2.6%
1 ene 2009 año
24.963
-0.203
-0.81%
1 ene 2010 año
25.065
+0.102
0.41%
1 ene 2011 año
24.874
-0.191
-0.76%
1 ene 2012 año
24.711
-0.163
-0.66%
1 ene 2013 año
24.968
+0.258
1.04%
1 ene 2014 año
25.456
+0.487
1.95%
Ranking de los países por los datos estadísticos actuales


Comentarios: