29
/es/
es
AIzaSyAYiBZKx7MnpbEhh9jyipgxe19OcubqV5w
April 1, 2024
286167
Zambia
ZMB
true
2
1
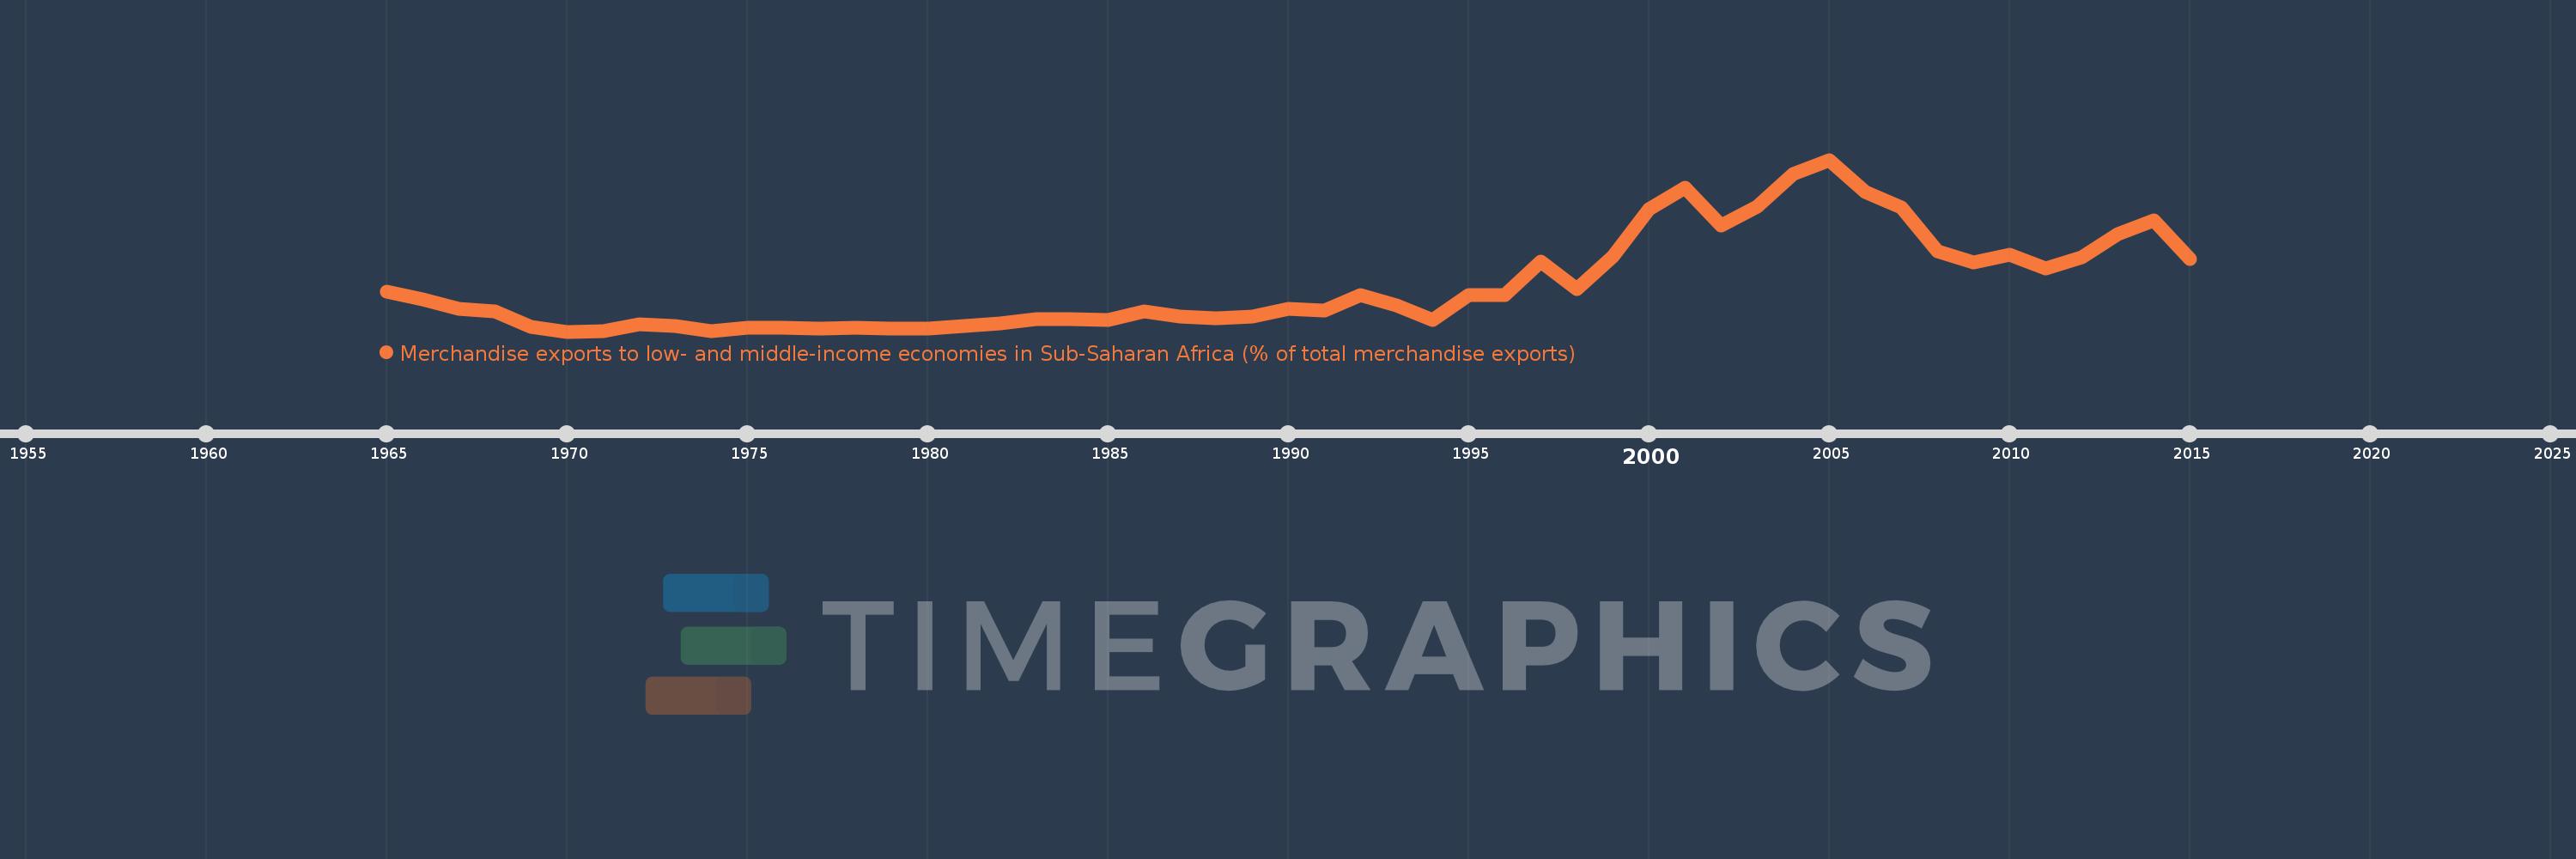
Merchandise exports to low- and middle-income economies in Sub-Saharan Africa (% of total merchandise exports)
2015,2014,2013,2012,2011,2010,2009,2008,2007,2006,2005,2004,2003,2002,2001,2000,1999,1998,1997,1996,1995,1994,1993,1992,1991,1990,1989,1988,1987,1986,1985,1984,1983,1982,1981,1980,1979,1978,1977,1976,1975,1974,1973,1972,1971,1970,1969,1968,1967,1966,1965
Estas estadísticas en otros países:
AfghanistanAlbaniaAlgeriaAngolaArab WorldArgentinaArmeniaAustraliaAustriaAzerbaijanBahamas, TheBahrainBangladeshBarbadosBelarusBelgiumBelizeBeninBermudaBoliviaBrazilBulgariaBurkina FasoBurundiCabo VerdeCambodiaCameroonCanadaCaribbean small statesCentral African RepublicCentral Europe and the BalticsChadChileChinaColombiaCongo, Dem. Rep.Congo, Rep.Costa RicaCote d'IvoireCroatiaCubaCyprusCzech RepublicDenmarkDjiboutiDominicaDominican RepublicEarly-demographic dividendEast Asia & PacificEast Asia & Pacific (excluding high income)East Asia & Pacific (IDA & IBRD countries)EcuadorEgypt, Arab Rep.EstoniaEthiopiaEuro areaEurope & Central AsiaEurope & Central Asia (excluding high income)Europe & Central Asia (IDA & IBRD countries)European UnionFijiFinlandFragile and conflict affected situationsFranceGabonGambia, TheGeorgiaGermanyGhanaGibraltarGreeceGreenlandGuatemalaGuineaGuinea-BissauGuyanaHaitiHeavily indebted poor countries (HIPC)High incomeHondurasHong Kong SAR, ChinaHungaryIBRD onlyIcelandIDA & IBRD totalIDA blendIDA onlyIDA totalIndiaIndonesiaIran, Islamic Rep.IraqIrelandIsraelItalyJamaicaJapanJordanKazakhstanKenyaKorea, Dem. People’s Rep.Korea, Rep.KuwaitLao PDRLate-demographic dividendLatin America & Caribbean Latin America & Caribbean (excluding high income)Latin America & the Caribbean (IDA & IBRD countries)LatviaLeast developed countries: UN classificationLebanonLiberiaLibyaLithuaniaLow & middle incomeLow incomeLower middle incomeLuxembourgMacao SAR, ChinaMacedonia, FYRMadagascarMalawiMalaysiaMaliMaltaMauritaniaMauritiusMexicoMiddle East & North AfricaMiddle East & North Africa (excluding high income)Middle East & North Africa (IDA & IBRD countries)Middle incomeMoldovaMontenegroMoroccoMozambiqueMyanmarNetherlandsNew ZealandNicaraguaNigerNigeriaNorth AmericaNorwayOECD membersOmanOther small statesPacific island small statesPakistanPanamaPapua New GuineaParaguayPeruPhilippinesPolandPortugalPost-demographic dividendPre-demographic dividendQatarRomaniaRussian FederationRwandaSaudi ArabiaSenegalSerbiaSeychellesSierra LeoneSingaporeSlovak RepublicSloveniaSmall statesSomaliaSouth AfricaSouth AsiaSouth Asia (IDA & IBRD)SpainSri LankaSt. LuciaSt. Vincent and the GrenadinesSub-Saharan Africa Sub-Saharan Africa (excluding high income)Sub-Saharan Africa (IDA & IBRD countries)SudanSurinameSwedenSwitzerlandSyrian Arab RepublicTanzaniaThailandTogoTrinidad and TobagoTunisiaTurkeyUgandaUkraineUnited Arab EmiratesUnited KingdomUnited StatesUpper middle incomeUruguayVenezuela, RBVietnamWorldYemen, Rep.ZambiaZimbabwe línea de tiempo (timeline):
En esta escala de tiempo se presenta un gráfico de 1965 y 2015 de Zambia. Los datos de 1964 están ausentes. El número de observaciones reales por fecha: 51.
Fuente (nombre):
Indicadores del desarrollo mundial
Fuente (organización):
World Bank staff estimates based data from International Monetary Fund's Direction of Trade database.
Categorías:
Private Sector, Trade
Se ha actualizado:
23 abr 2017 año
Los indicadores de los cambios de valor en los últimos años
Mínimo:
2.065
1 ene 1970 año
Máximo:
49.345
1 ene 2005 año
A la fecha de observación
Valor
Cambio absoluto
El cambio con respecto al valor anterior
1 ene 1965 año
12.969
+12.969
0.0%
1 ene 1966 año
10.982
-1.988
-15.33%
1 ene 1967 año
8.345
-2.636
-24.01%
1 ene 1968 año
7.643
-0.702
-8.41%
1 ene 1969 año
3.457
-4.186
-54.77%
1 ene 1970 año
2.065
-1.392
-40.27%
1 ene 1971 año
2.22
+0.155
7.49%
1 ene 1972 año
4.001
+1.782
80.27%
1 ene 1973 año
3.695
-0.306
-7.65%
1 ene 1974 año
2.08
-1.615
-43.7%
1 ene 1975 año
3.18
+1.099
52.83%
1 ene 1976 año
3.042
-0.138
-4.33%
1 ene 1977 año
2.85
-0.192
-6.32%
1 ene 1978 año
3.035
+0.185
6.51%
1 ene 1979 año
2.914
-0.121
-3.99%
1 ene 1980 año
2.967
+0.053
1.82%
1 ene 1981 año
3.659
+0.692
23.31%
1 ene 1982 año
4.303
+0.645
17.62%
1 ene 1983 año
5.581
+1.277
29.68%
1 ene 1984 año
5.581
+0.0
0.0%
1 ene 1985 año
5.179
-0.402
-7.21%
1 ene 1986 año
7.615
+2.437
47.05%
1 ene 1987 año
6.238
-1.378
-18.09%
1 ene 1988 año
5.745
-0.492
-7.89%
1 ene 1989 año
6.235
+0.489
8.52%
1 ene 1990 año
8.381
+2.146
34.42%
1 ene 1991 año
7.77
-0.611
-7.28%
1 ene 1992 año
12.186
+4.415
56.82%
1 ene 1993 año
9.292
-2.894
-23.75%
1 ene 1994 año
5.166
-4.126
-44.41%
1 ene 1995 año
12.128
+6.962
134.77%
1 ene 1996 año
12.038
-0.091
-0.75%
1 ene 1997 año
21.447
+9.409
78.17%
1 ene 1998 año
13.69
-7.757
-36.17%
1 ene 1999 año
22.727
+9.037
66.01%
1 ene 2000 año
35.649
+12.922
56.86%
1 ene 2001 año
41.78
+6.131
17.2%
1 ene 2002 año
31.292
-10.488
-25.1%
1 ene 2003 año
36.351
+5.059
16.17%
1 ene 2004 año
45.521
+9.17
25.23%
1 ene 2005 año
49.345
+3.824
8.4%
1 ene 2006 año
40.542
-8.803
-17.84%
1 ene 2007 año
36.266
-4.277
-10.55%
1 ene 2008 año
24.065
-12.201
-33.64%
1 ene 2009 año
20.995
-3.07
-12.76%
1 ene 2010 año
23.157
+2.162
10.3%
1 ene 2011 año
19.375
-3.782
-16.33%
1 ene 2012 año
22.552
+3.177
16.4%
1 ene 2013 año
28.939
+6.387
28.32%
1 ene 2014 año
32.793
+3.854
13.32%
1 ene 2015 año
22.091
-10.702
-32.64%
Ranking de los países por los datos estadísticos actuales


Comentarios: