29
/es/
es
AIzaSyAYiBZKx7MnpbEhh9jyipgxe19OcubqV5w
April 1, 2024
159666
Ireland
IRL
true
2
1
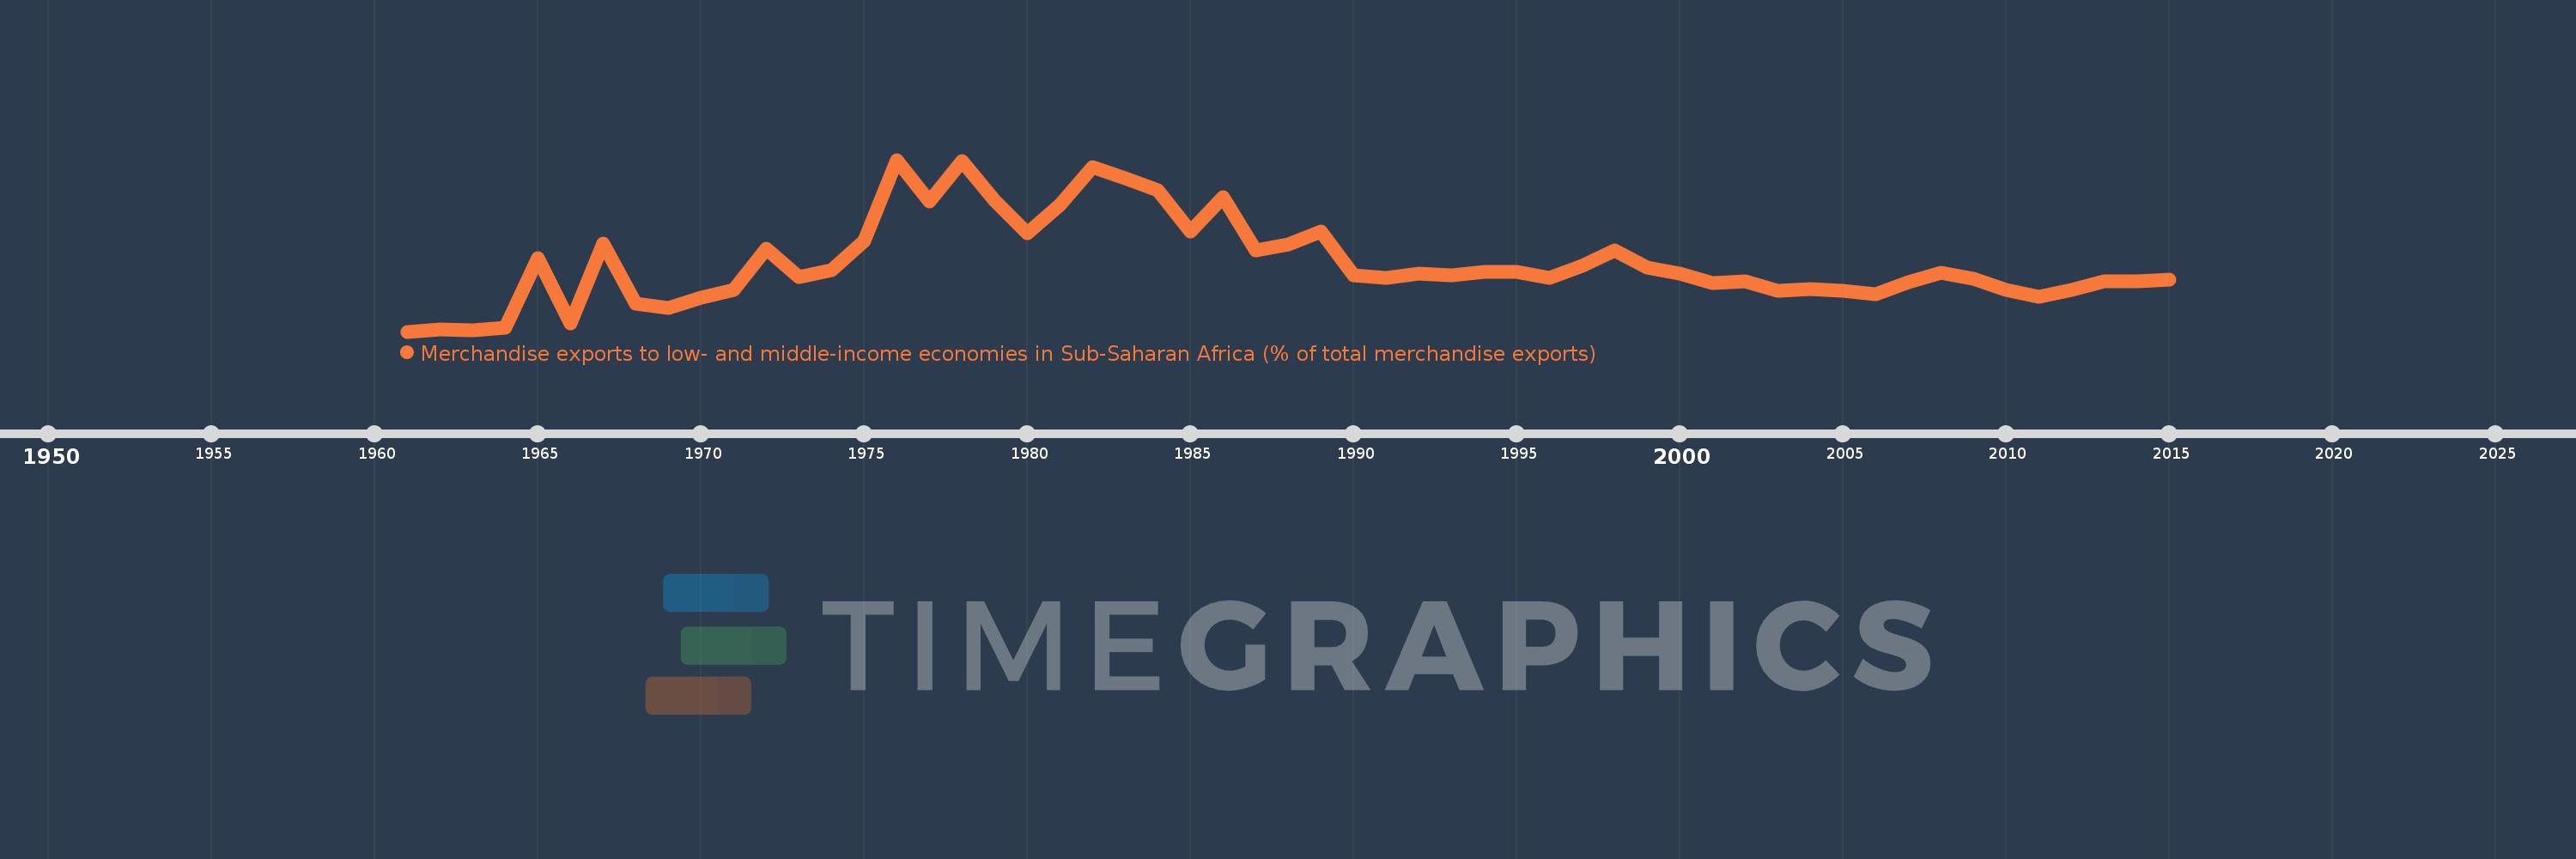
Merchandise exports to low- and middle-income economies in Sub-Saharan Africa (% of total merchandise exports)
2015,2014,2013,2012,2011,2010,2009,2008,2007,2006,2005,2004,2003,2002,2001,2000,1999,1998,1997,1996,1995,1994,1993,1992,1991,1990,1989,1988,1987,1986,1985,1984,1983,1982,1981,1980,1979,1978,1977,1976,1975,1974,1973,1972,1971,1970,1969,1968,1967,1966,1965,1964,1963,1962,1961
Estas estadísticas en otros países:
AfghanistanAlbaniaAlgeriaAngolaArab WorldArgentinaArmeniaAustraliaAustriaAzerbaijanBahamas, TheBahrainBangladeshBarbadosBelarusBelgiumBelizeBeninBermudaBoliviaBrazilBulgariaBurkina FasoBurundiCabo VerdeCambodiaCameroonCanadaCaribbean small statesCentral African RepublicCentral Europe and the BalticsChadChileChinaColombiaCongo, Dem. Rep.Congo, Rep.Costa RicaCote d'IvoireCroatiaCubaCyprusCzech RepublicDenmarkDjiboutiDominicaDominican RepublicEarly-demographic dividendEast Asia & PacificEast Asia & Pacific (excluding high income)East Asia & Pacific (IDA & IBRD countries)EcuadorEgypt, Arab Rep.EstoniaEthiopiaEuro areaEurope & Central AsiaEurope & Central Asia (excluding high income)Europe & Central Asia (IDA & IBRD countries)European UnionFijiFinlandFragile and conflict affected situationsFranceGabonGambia, TheGeorgiaGermanyGhanaGibraltarGreeceGreenlandGuatemalaGuineaGuinea-BissauGuyanaHaitiHeavily indebted poor countries (HIPC)High incomeHondurasHong Kong SAR, ChinaHungaryIBRD onlyIcelandIDA & IBRD totalIDA blendIDA onlyIDA totalIndiaIndonesiaIran, Islamic Rep.IraqIrelandIsraelItalyJamaicaJapanJordanKazakhstanKenyaKorea, Dem. People’s Rep.Korea, Rep.KuwaitLao PDRLate-demographic dividendLatin America & Caribbean Latin America & Caribbean (excluding high income)Latin America & the Caribbean (IDA & IBRD countries)LatviaLeast developed countries: UN classificationLebanonLiberiaLibyaLithuaniaLow & middle incomeLow incomeLower middle incomeLuxembourgMacao SAR, ChinaMacedonia, FYRMadagascarMalawiMalaysiaMaliMaltaMauritaniaMauritiusMexicoMiddle East & North AfricaMiddle East & North Africa (excluding high income)Middle East & North Africa (IDA & IBRD countries)Middle incomeMoldovaMontenegroMoroccoMozambiqueMyanmarNetherlandsNew ZealandNicaraguaNigerNigeriaNorth AmericaNorwayOECD membersOmanOther small statesPacific island small statesPakistanPanamaPapua New GuineaParaguayPeruPhilippinesPolandPortugalPost-demographic dividendPre-demographic dividendQatarRomaniaRussian FederationRwandaSaudi ArabiaSenegalSerbiaSeychellesSierra LeoneSingaporeSlovak RepublicSloveniaSmall statesSomaliaSouth AfricaSouth AsiaSouth Asia (IDA & IBRD)SpainSri LankaSt. LuciaSt. Vincent and the GrenadinesSub-Saharan Africa Sub-Saharan Africa (excluding high income)Sub-Saharan Africa (IDA & IBRD countries)SudanSurinameSwedenSwitzerlandSyrian Arab RepublicTanzaniaThailandTogoTrinidad and TobagoTunisiaTurkeyUgandaUkraineUnited Arab EmiratesUnited KingdomUnited StatesUpper middle incomeUruguayVenezuela, RBVietnamWorldYemen, Rep.ZambiaZimbabwe línea de tiempo (timeline):
En esta escala de tiempo se presenta un gráfico de 1961 y 2015 de Ireland. Los datos de 1960 están ausentes. El número de observaciones reales por fecha: 55.
Fuente (nombre):
Indicadores del desarrollo mundial
Fuente (organización):
World Bank staff estimates based data from International Monetary Fund's Direction of Trade database.
Categorías:
Private Sector, Trade
Se ha actualizado:
23 abr 2017 año
Los indicadores de los cambios de valor en los últimos años
Mínimo:
0.212
1 ene 1961 año
Máximo:
2.197
1 ene 1976 año
A la fecha de observación
Valor
Cambio absoluto
El cambio con respecto al valor anterior
1 ene 1961 año
0.212
+0.212
0.0%
1 ene 1962 año
0.238
+0.026
12.47%
1 ene 1963 año
0.226
-0.012
-5.02%
1 ene 1964 año
0.255
+0.029
12.97%
1 ene 1965 año
1.062
+0.806
315.76%
1 ene 1966 año
0.304
-0.758
-71.41%
1 ene 1967 año
1.226
+0.923
303.9%
1 ene 1968 año
0.535
-0.691
-56.35%
1 ene 1969 año
0.489
-0.046
-8.6%
1 ene 1970 año
0.6
+0.111
22.59%
1 ene 1971 año
0.693
+0.093
15.51%
1 ene 1972 año
1.171
+0.478
69.06%
1 ene 1973 año
0.84
-0.331
-28.27%
1 ene 1974 año
0.922
+0.082
9.81%
1 ene 1975 año
1.261
+0.338
36.65%
1 ene 1976 año
2.197
+0.937
74.31%
1 ene 1977 año
1.713
-0.484
-22.05%
1 ene 1978 año
2.18
+0.467
27.27%
1 ene 1979 año
1.721
-0.459
-21.06%
1 ene 1980 año
1.35
-0.371
-21.56%
1 ene 1981 año
1.678
+0.328
24.32%
1 ene 1982 año
2.117
+0.439
26.14%
1 ene 1983 año
1.987
-0.13
-6.12%
1 ene 1984 año
1.843
-0.144
-7.26%
1 ene 1985 año
1.371
-0.472
-25.6%
1 ene 1986 año
1.767
+0.396
28.85%
1 ene 1987 año
1.154
-0.613
-34.7%
1 ene 1988 año
1.222
+0.068
5.9%
1 ene 1989 año
1.369
+0.147
12.05%
1 ene 1990 año
0.861
-0.508
-37.13%
1 ene 1991 año
0.833
-0.028
-3.26%
1 ene 1992 año
0.884
+0.052
6.22%
1 ene 1993 año
0.861
-0.023
-2.62%
1 ene 1994 año
0.897
+0.036
4.21%
1 ene 1995 año
0.9
+0.003
0.33%
1 ene 1996 año
0.837
-0.063
-7.01%
1 ene 1997 año
0.969
+0.132
15.75%
1 ene 1998 año
1.146
+0.176
18.2%
1 ene 1999 año
0.956
-0.19
-16.57%
1 ene 2000 año
0.883
-0.072
-7.57%
1 ene 2001 año
0.774
-0.109
-12.34%
1 ene 2002 año
0.789
+0.014
1.83%
1 ene 2003 año
0.685
-0.103
-13.12%
1 ene 2004 año
0.702
+0.017
2.43%
1 ene 2005 año
0.686
-0.016
-2.29%
1 ene 2006 año
0.648
-0.038
-5.56%
1 ene 2007 año
0.784
+0.136
21.07%
1 ene 2008 año
0.894
+0.11
14.02%
1 ene 2009 año
0.821
-0.073
-8.18%
1 ene 2010 año
0.693
-0.128
-15.61%
1 ene 2011 año
0.615
-0.077
-11.17%
1 ene 2012 año
0.693
+0.078
12.62%
1 ene 2013 año
0.795
+0.102
14.71%
1 ene 2014 año
0.792
-0.003
-0.38%
1 ene 2015 año
0.81
+0.018
2.3%
Ranking de los países por los datos estadísticos actuales


Comentarios: