29
/es/
es
AIzaSyAYiBZKx7MnpbEhh9jyipgxe19OcubqV5w
April 1, 2024
253287
Sudan
SDN
true
2
1
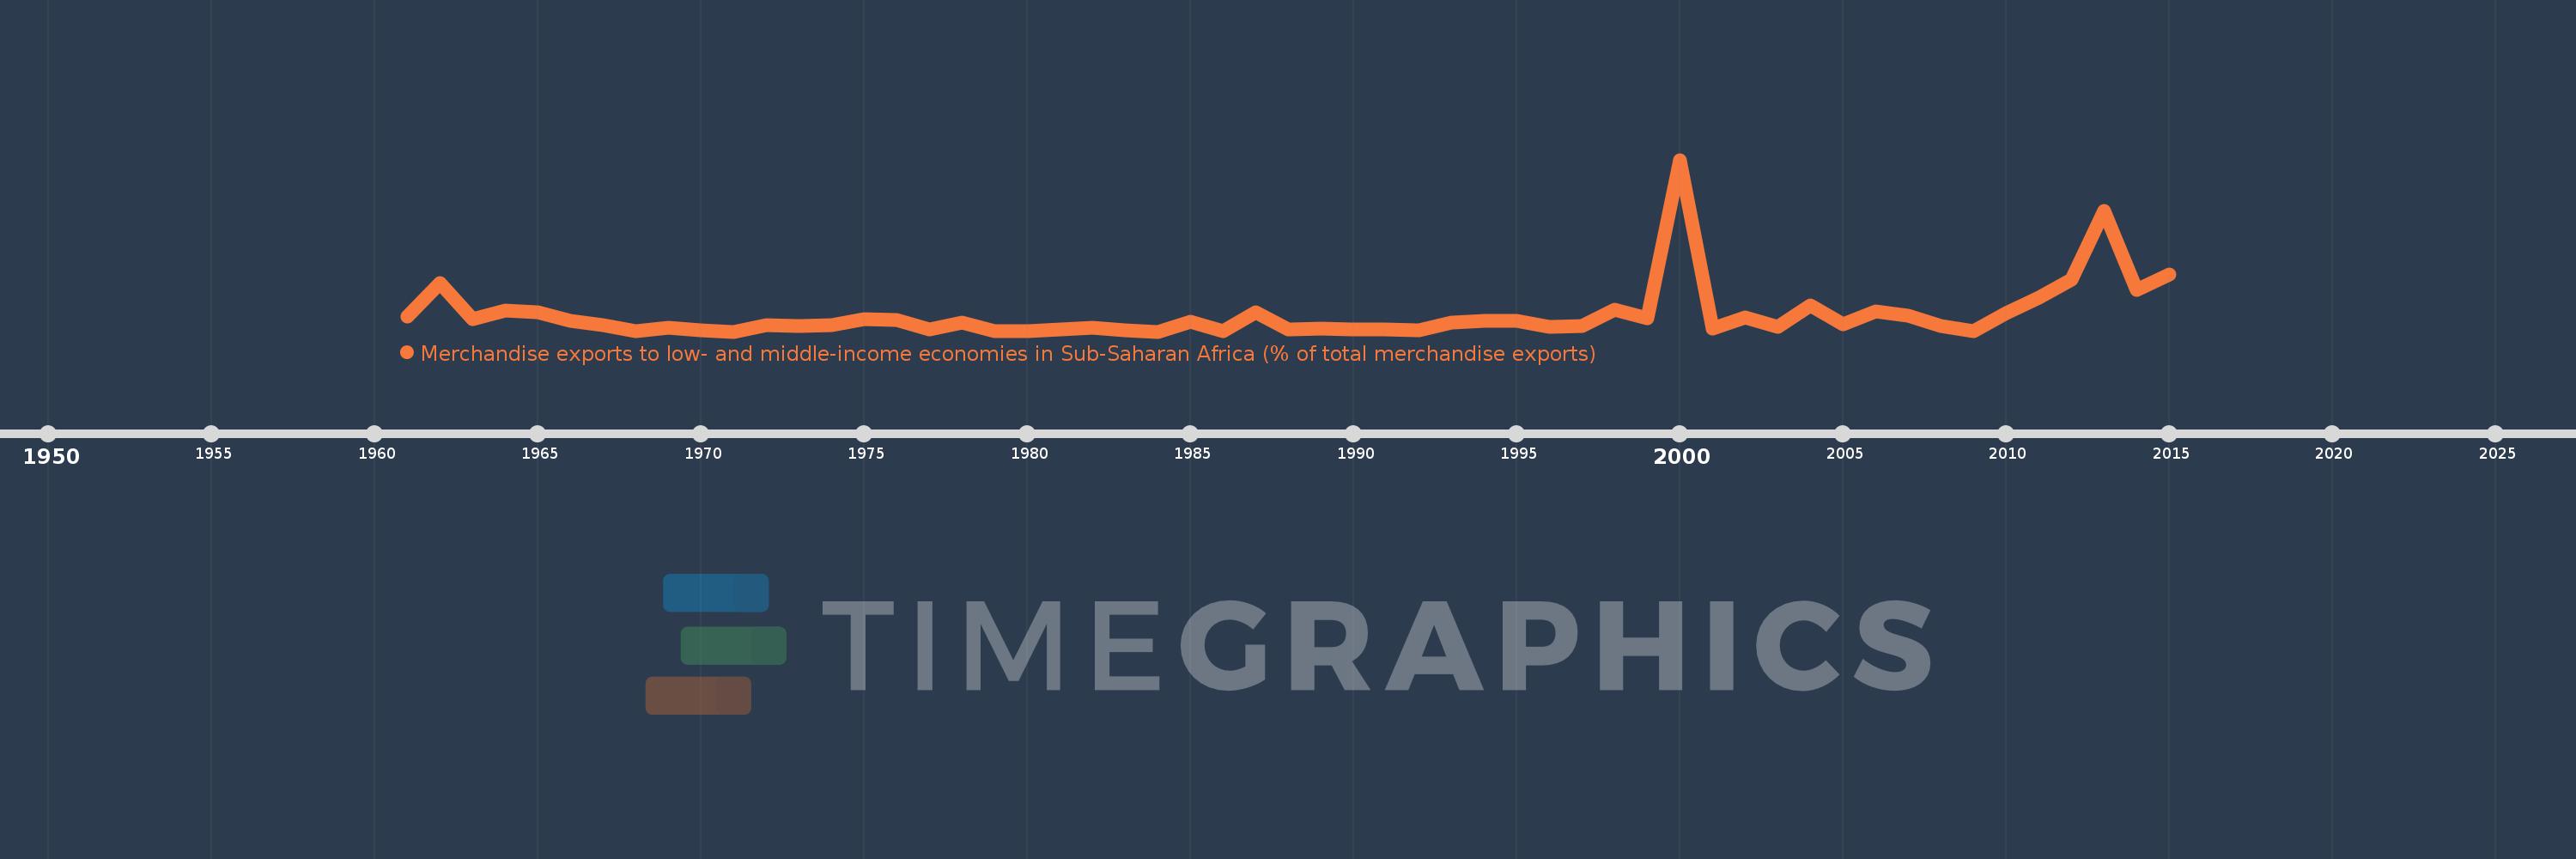
Merchandise exports to low- and middle-income economies in Sub-Saharan Africa (% of total merchandise exports)
2015,2014,2013,2012,2011,2010,2009,2008,2007,2006,2005,2004,2003,2002,2001,2000,1999,1998,1997,1996,1995,1994,1993,1992,1991,1990,1989,1988,1987,1986,1985,1984,1983,1982,1981,1980,1979,1978,1977,1976,1975,1974,1973,1972,1971,1970,1969,1968,1967,1966,1965,1964,1963,1962,1961
Estas estadísticas en otros países:
AfghanistanAlbaniaAlgeriaAngolaArab WorldArgentinaArmeniaAustraliaAustriaAzerbaijanBahamas, TheBahrainBangladeshBarbadosBelarusBelgiumBelizeBeninBermudaBoliviaBrazilBulgariaBurkina FasoBurundiCabo VerdeCambodiaCameroonCanadaCaribbean small statesCentral African RepublicCentral Europe and the BalticsChadChileChinaColombiaCongo, Dem. Rep.Congo, Rep.Costa RicaCote d'IvoireCroatiaCubaCyprusCzech RepublicDenmarkDjiboutiDominicaDominican RepublicEarly-demographic dividendEast Asia & PacificEast Asia & Pacific (excluding high income)East Asia & Pacific (IDA & IBRD countries)EcuadorEgypt, Arab Rep.EstoniaEthiopiaEuro areaEurope & Central AsiaEurope & Central Asia (excluding high income)Europe & Central Asia (IDA & IBRD countries)European UnionFijiFinlandFragile and conflict affected situationsFranceGabonGambia, TheGeorgiaGermanyGhanaGibraltarGreeceGreenlandGuatemalaGuineaGuinea-BissauGuyanaHaitiHeavily indebted poor countries (HIPC)High incomeHondurasHong Kong SAR, ChinaHungaryIBRD onlyIcelandIDA & IBRD totalIDA blendIDA onlyIDA totalIndiaIndonesiaIran, Islamic Rep.IraqIrelandIsraelItalyJamaicaJapanJordanKazakhstanKenyaKorea, Dem. People’s Rep.Korea, Rep.KuwaitLao PDRLate-demographic dividendLatin America & Caribbean Latin America & Caribbean (excluding high income)Latin America & the Caribbean (IDA & IBRD countries)LatviaLeast developed countries: UN classificationLebanonLiberiaLibyaLithuaniaLow & middle incomeLow incomeLower middle incomeLuxembourgMacao SAR, ChinaMacedonia, FYRMadagascarMalawiMalaysiaMaliMaltaMauritaniaMauritiusMexicoMiddle East & North AfricaMiddle East & North Africa (excluding high income)Middle East & North Africa (IDA & IBRD countries)Middle incomeMoldovaMontenegroMoroccoMozambiqueMyanmarNetherlandsNew ZealandNicaraguaNigerNigeriaNorth AmericaNorwayOECD membersOmanOther small statesPacific island small statesPakistanPanamaPapua New GuineaParaguayPeruPhilippinesPolandPortugalPost-demographic dividendPre-demographic dividendQatarRomaniaRussian FederationRwandaSaudi ArabiaSenegalSerbiaSeychellesSierra LeoneSingaporeSlovak RepublicSloveniaSmall statesSomaliaSouth AfricaSouth AsiaSouth Asia (IDA & IBRD)SpainSri LankaSt. LuciaSt. Vincent and the GrenadinesSub-Saharan Africa Sub-Saharan Africa (excluding high income)Sub-Saharan Africa (IDA & IBRD countries)SudanSurinameSwedenSwitzerlandSyrian Arab RepublicTanzaniaThailandTogoTrinidad and TobagoTunisiaTurkeyUgandaUkraineUnited Arab EmiratesUnited KingdomUnited StatesUpper middle incomeUruguayVenezuela, RBVietnamWorldYemen, Rep.ZambiaZimbabwe línea de tiempo (timeline):
En esta escala de tiempo se presenta un gráfico de 1961 y 2015 de Sudan. Los datos de 1960 están ausentes. El número de observaciones reales por fecha: 55.
Fuente (nombre):
Indicadores del desarrollo mundial
Fuente (organización):
World Bank staff estimates based data from International Monetary Fund's Direction of Trade database.
Categorías:
Private Sector, Trade
Se ha actualizado:
23 abr 2017 año
Los indicadores de los cambios de valor en los últimos años
Máximo:
10.438
1 ene 2000 año
A la fecha de observación
Valor
Cambio absoluto
El cambio con respecto al valor anterior
1 ene 1961 año
0.936
+0.936
0.0%
1 ene 1962 año
2.971
+2.035
217.53%
1 ene 1963 año
0.75
-2.221
-74.75%
1 ene 1964 año
1.284
+0.534
71.12%
1 ene 1965 año
1.171
-0.113
-8.78%
1 ene 1966 año
0.666
-0.505
-43.1%
1 ene 1967 año
0.395
-0.272
-40.77%
1 ene 1968 año
0.047
-0.348
-88.17%
1 ene 1969 año
0.215
+0.169
360.83%
1 ene 1970 año
0.103
-0.112
-52.03%
1 ene 1971 año
0.0
-0.103
-100.0%
1 ene 1972 año
0.397
+0.397
%
1 ene 1973 año
0.315
-0.082
-20.58%
1 ene 1974 año
0.406
+0.091
28.77%
1 ene 1975 año
0.738
+0.331
81.55%
1 ene 1976 año
0.699
-0.038
-5.18%
1 ene 1977 año
0.137
-0.562
-80.37%
1 ene 1978 año
0.55
+0.413
300.44%
1 ene 1979 año
0.005
-0.544
-99.03%
1 ene 1980 año
0.052
+0.047
868.11%
1 ene 1981 año
0.122
+0.07
134.58%
1 ene 1982 año
0.215
+0.094
76.88%
1 ene 1983 año
0.1
-0.116
-53.66%
1 ene 1984 año
0.0
-0.1
-100.0%
1 ene 1985 año
0.621
+0.621
%
1 ene 1986 año
0.05
-0.571
-91.98%
1 ene 1987 año
1.177
+1.127
2.26 mil%
1 ene 1988 año
0.111
-1.066
-90.6%
1 ene 1989 año
0.183
+0.072
65.4%
1 ene 1990 año
0.137
-0.046
-25.15%
1 ene 1991 año
0.11
-0.027
-19.6%
1 ene 1992 año
0.079
-0.031
-27.86%
1 ene 1993 año
0.532
+0.453
569.88%
1 ene 1994 año
0.645
+0.113
21.24%
1 ene 1995 año
0.657
+0.012
1.86%
1 ene 1996 año
0.294
-0.364
-55.34%
1 ene 1997 año
0.351
+0.058
19.7%
1 ene 1998 año
1.32
+0.969
275.67%
1 ene 1999 año
0.801
-0.519
-39.33%
1 ene 2000 año
10.438
+9.637
1.2 mil%
1 ene 2001 año
0.169
-10.269
-98.38%
1 ene 2002 año
0.846
+0.676
399.9%
1 ene 2003 año
0.267
-0.578
-68.4%
1 ene 2004 año
1.59
+1.323
494.98%
1 ene 2005 año
0.42
-1.17
-73.6%
1 ene 2006 año
1.241
+0.821
195.66%
1 ene 2007 año
0.942
-0.299
-24.06%
1 ene 2008 año
0.334
-0.608
-64.53%
1 ene 2009 año
0.04
-0.295
-88.15%
1 ene 2010 año
1.121
+1.081
2.73 mil%
1 ene 2011 año
2.072
+0.951
84.89%
1 ene 2012 año
3.152
+1.08
52.12%
1 ene 2013 año
7.358
+4.206
133.45%
1 ene 2014 año
2.544
-4.813
-65.42%
1 ene 2015 año
3.488
+0.944
37.09%
Ranking de los países por los datos estadísticos actuales


Comentarios: