29
/es/
es
AIzaSyAYiBZKx7MnpbEhh9jyipgxe19OcubqV5w
April 1, 2024
268273
Tunisia
TUN
true
2
1
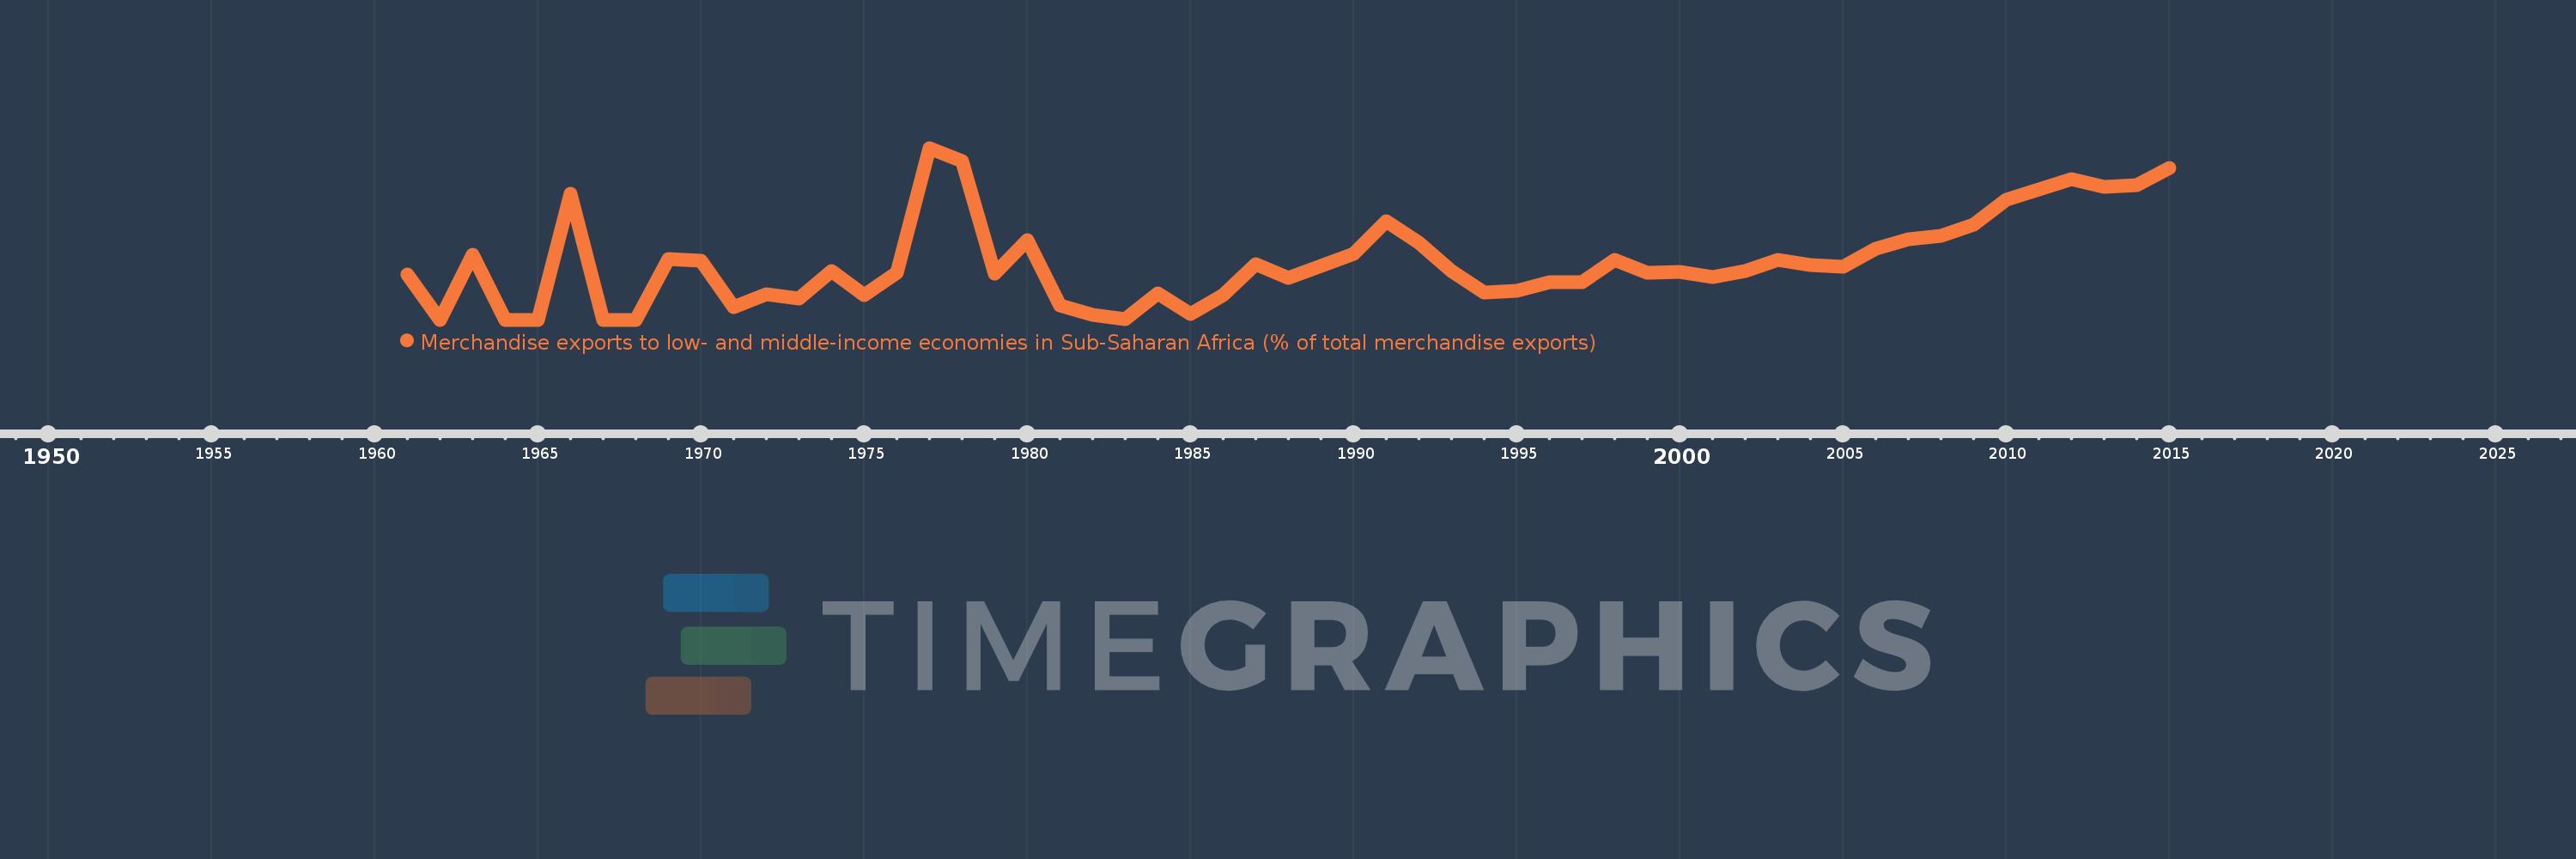
Merchandise exports to low- and middle-income economies in Sub-Saharan Africa (% of total merchandise exports)
2015,2014,2013,2012,2011,2010,2009,2008,2007,2006,2005,2004,2003,2002,2001,2000,1999,1998,1997,1996,1995,1994,1993,1992,1991,1990,1989,1988,1987,1986,1985,1984,1983,1982,1981,1980,1979,1978,1977,1976,1975,1974,1973,1972,1971,1970,1969,1968,1967,1966,1965,1964,1963,1962,1961
Estas estadísticas en otros países:
AfghanistanAlbaniaAlgeriaAngolaArab WorldArgentinaArmeniaAustraliaAustriaAzerbaijanBahamas, TheBahrainBangladeshBarbadosBelarusBelgiumBelizeBeninBermudaBoliviaBrazilBulgariaBurkina FasoBurundiCabo VerdeCambodiaCameroonCanadaCaribbean small statesCentral African RepublicCentral Europe and the BalticsChadChileChinaColombiaCongo, Dem. Rep.Congo, Rep.Costa RicaCote d'IvoireCroatiaCubaCyprusCzech RepublicDenmarkDjiboutiDominicaDominican RepublicEarly-demographic dividendEast Asia & PacificEast Asia & Pacific (excluding high income)East Asia & Pacific (IDA & IBRD countries)EcuadorEgypt, Arab Rep.EstoniaEthiopiaEuro areaEurope & Central AsiaEurope & Central Asia (excluding high income)Europe & Central Asia (IDA & IBRD countries)European UnionFijiFinlandFragile and conflict affected situationsFranceGabonGambia, TheGeorgiaGermanyGhanaGibraltarGreeceGreenlandGuatemalaGuineaGuinea-BissauGuyanaHaitiHeavily indebted poor countries (HIPC)High incomeHondurasHong Kong SAR, ChinaHungaryIBRD onlyIcelandIDA & IBRD totalIDA blendIDA onlyIDA totalIndiaIndonesiaIran, Islamic Rep.IraqIrelandIsraelItalyJamaicaJapanJordanKazakhstanKenyaKorea, Dem. People’s Rep.Korea, Rep.KuwaitLao PDRLate-demographic dividendLatin America & Caribbean Latin America & Caribbean (excluding high income)Latin America & the Caribbean (IDA & IBRD countries)LatviaLeast developed countries: UN classificationLebanonLiberiaLibyaLithuaniaLow & middle incomeLow incomeLower middle incomeLuxembourgMacao SAR, ChinaMacedonia, FYRMadagascarMalawiMalaysiaMaliMaltaMauritaniaMauritiusMexicoMiddle East & North AfricaMiddle East & North Africa (excluding high income)Middle East & North Africa (IDA & IBRD countries)Middle incomeMoldovaMontenegroMoroccoMozambiqueMyanmarNetherlandsNew ZealandNicaraguaNigerNigeriaNorth AmericaNorwayOECD membersOmanOther small statesPacific island small statesPakistanPanamaPapua New GuineaParaguayPeruPhilippinesPolandPortugalPost-demographic dividendPre-demographic dividendQatarRomaniaRussian FederationRwandaSaudi ArabiaSenegalSerbiaSeychellesSierra LeoneSingaporeSlovak RepublicSloveniaSmall statesSomaliaSouth AfricaSouth AsiaSouth Asia (IDA & IBRD)SpainSri LankaSt. LuciaSt. Vincent and the GrenadinesSub-Saharan Africa Sub-Saharan Africa (excluding high income)Sub-Saharan Africa (IDA & IBRD countries)SudanSurinameSwedenSwitzerlandSyrian Arab RepublicTanzaniaThailandTogoTrinidad and TobagoTunisiaTurkeyUgandaUkraineUnited Arab EmiratesUnited KingdomUnited StatesUpper middle incomeUruguayVenezuela, RBVietnamWorldYemen, Rep.ZambiaZimbabwe línea de tiempo (timeline):
En esta escala de tiempo se presenta un gráfico de 1961 y 2015 de Tunisia. Los datos de 1960 están ausentes. El número de observaciones reales por fecha: 55.
Fuente (nombre):
Indicadores del desarrollo mundial
Fuente (organización):
World Bank staff estimates based data from International Monetary Fund's Direction of Trade database.
Categorías:
Private Sector, Trade
Se ha actualizado:
23 abr 2017 año
Los indicadores de los cambios de valor en los últimos años
Máximo:
3.191
1 ene 1977 año
A la fecha de observación
Valor
Cambio absoluto
El cambio con respecto al valor anterior
1 ene 1961 año
0.837
+0.837
0.0%
1 ene 1962 año
0.0
-0.837
-100.0%
1 ene 1963 año
1.21
+1.21
%
1 ene 1964 año
0.0
-1.21
-100.0%
1 ene 1966 año
2.335
+2.335
%
1 ene 1967 año
0.0
-2.335
-100.0%
1 ene 1969 año
1.129
+1.129
%
1 ene 1970 año
1.099
-0.029
-2.61%
1 ene 1971 año
0.239
-0.86
-78.23%
1 ene 1972 año
0.474
+0.234
97.95%
1 ene 1973 año
0.402
-0.072
-15.11%
1 ene 1974 año
0.898
+0.495
123.22%
1 ene 1975 año
0.453
-0.445
-49.58%
1 ene 1976 año
0.877
+0.425
93.86%
1 ene 1977 año
3.191
+2.314
263.7%
1 ene 1978 año
2.95
-0.241
-7.55%
1 ene 1979 año
0.864
-2.086
-70.73%
1 ene 1980 año
1.483
+0.62
71.74%
1 ene 1981 año
0.269
-1.214
-81.83%
1 ene 1982 año
0.087
-0.182
-67.62%
1 ene 1983 año
0.017
-0.071
-80.87%
1 ene 1984 año
0.494
+0.478
2.86 mil%
1 ene 1985 año
0.1
-0.394
-79.68%
1 ene 1986 año
0.453
+0.353
351.52%
1 ene 1987 año
1.039
+0.585
129.06%
1 ene 1988 año
0.773
-0.265
-25.56%
1 ene 1989 año
1.0
+0.227
29.32%
1 ene 1990 año
1.219
+0.219
21.9%
1 ene 1991 año
1.829
+0.61
50.0%
1 ene 1992 año
1.428
-0.4
-21.89%
1 ene 1993 año
0.909
-0.52
-36.37%
1 ene 1994 año
0.502
-0.407
-44.78%
1 ene 1995 año
0.535
+0.033
6.64%
1 ene 1996 año
0.701
+0.166
30.97%
1 ene 1997 año
0.699
-0.002
-0.32%
1 ene 1998 año
1.105
+0.407
58.2%
1 ene 1999 año
0.878
-0.227
-20.56%
1 ene 2000 año
0.882
+0.003
0.39%
1 ene 2001 año
0.789
-0.093
-10.5%
1 ene 2002 año
0.9
+0.111
14.13%
1 ene 2003 año
1.106
+0.205
22.8%
1 ene 2004 año
1.022
-0.084
-7.56%
1 ene 2005 año
0.991
-0.032
-3.09%
1 ene 2006 año
1.318
+0.327
33.02%
1 ene 2007 año
1.492
+0.175
13.26%
1 ene 2008 año
1.554
+0.061
4.11%
1 ene 2009 año
1.76
+0.206
13.26%
1 ene 2010 año
2.223
+0.464
26.36%
1 ene 2011 año
2.419
+0.195
8.78%
1 ene 2012 año
2.615
+0.196
8.12%
1 ene 2013 año
2.462
-0.153
-5.85%
1 ene 2014 año
2.5
+0.038
1.55%
1 ene 2015 año
2.823
+0.323
12.9%
Ranking de los países por los datos estadísticos actuales


Comentarios: