29
/es/
es
AIzaSyAYiBZKx7MnpbEhh9jyipgxe19OcubqV5w
April 1, 2024
261185
Tanzania
TZA
true
2
1
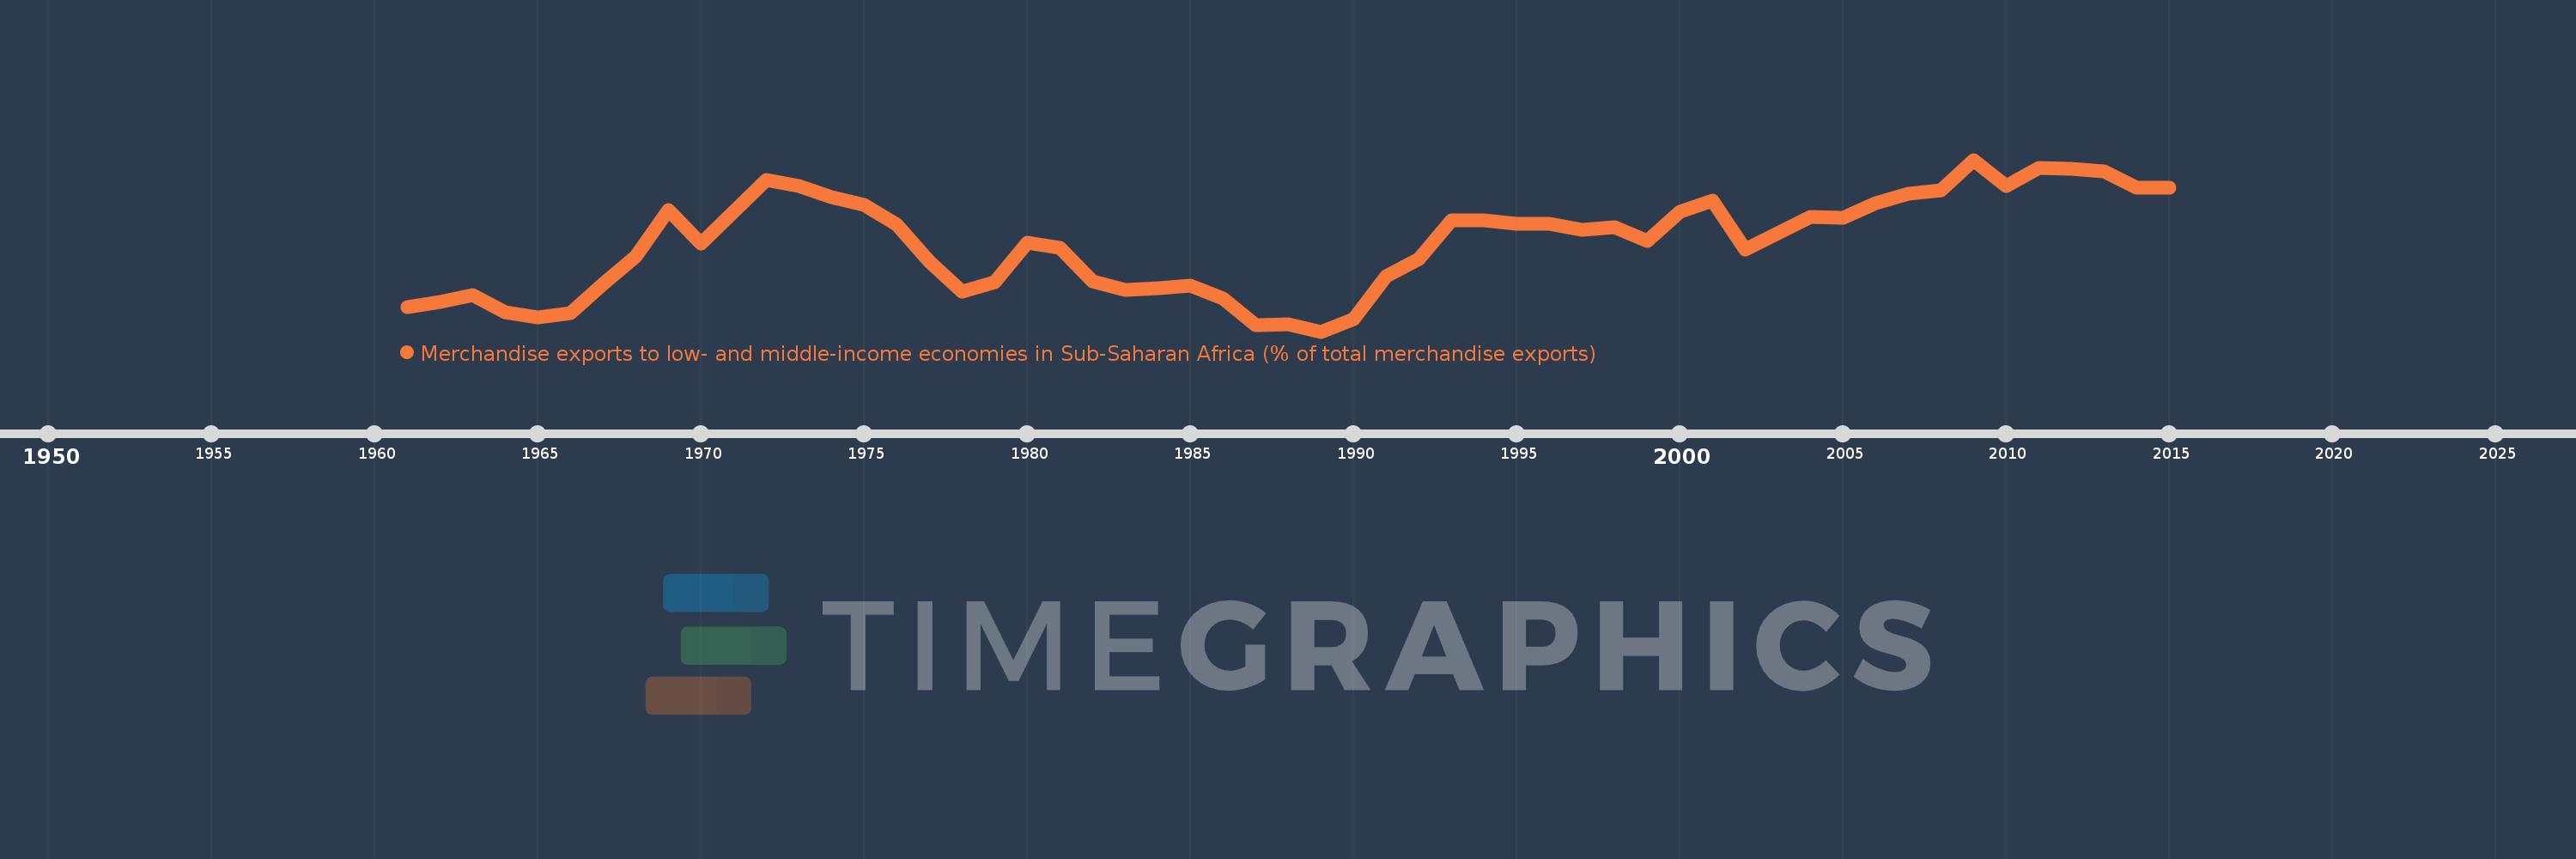
Merchandise exports to low- and middle-income economies in Sub-Saharan Africa (% of total merchandise exports)
2015,2014,2013,2012,2011,2010,2009,2008,2007,2006,2005,2004,2003,2002,2001,2000,1999,1998,1997,1996,1995,1994,1993,1992,1991,1990,1989,1988,1987,1986,1985,1984,1983,1982,1981,1980,1979,1978,1977,1976,1975,1974,1973,1972,1971,1970,1969,1968,1967,1966,1965,1964,1963,1962,1961
Estas estadísticas en otros países:
AfghanistanAlbaniaAlgeriaAngolaArab WorldArgentinaArmeniaAustraliaAustriaAzerbaijanBahamas, TheBahrainBangladeshBarbadosBelarusBelgiumBelizeBeninBermudaBoliviaBrazilBulgariaBurkina FasoBurundiCabo VerdeCambodiaCameroonCanadaCaribbean small statesCentral African RepublicCentral Europe and the BalticsChadChileChinaColombiaCongo, Dem. Rep.Congo, Rep.Costa RicaCote d'IvoireCroatiaCubaCyprusCzech RepublicDenmarkDjiboutiDominicaDominican RepublicEarly-demographic dividendEast Asia & PacificEast Asia & Pacific (excluding high income)East Asia & Pacific (IDA & IBRD countries)EcuadorEgypt, Arab Rep.EstoniaEthiopiaEuro areaEurope & Central AsiaEurope & Central Asia (excluding high income)Europe & Central Asia (IDA & IBRD countries)European UnionFijiFinlandFragile and conflict affected situationsFranceGabonGambia, TheGeorgiaGermanyGhanaGibraltarGreeceGreenlandGuatemalaGuineaGuinea-BissauGuyanaHaitiHeavily indebted poor countries (HIPC)High incomeHondurasHong Kong SAR, ChinaHungaryIBRD onlyIcelandIDA & IBRD totalIDA blendIDA onlyIDA totalIndiaIndonesiaIran, Islamic Rep.IraqIrelandIsraelItalyJamaicaJapanJordanKazakhstanKenyaKorea, Dem. People’s Rep.Korea, Rep.KuwaitLao PDRLate-demographic dividendLatin America & Caribbean Latin America & Caribbean (excluding high income)Latin America & the Caribbean (IDA & IBRD countries)LatviaLeast developed countries: UN classificationLebanonLiberiaLibyaLithuaniaLow & middle incomeLow incomeLower middle incomeLuxembourgMacao SAR, ChinaMacedonia, FYRMadagascarMalawiMalaysiaMaliMaltaMauritaniaMauritiusMexicoMiddle East & North AfricaMiddle East & North Africa (excluding high income)Middle East & North Africa (IDA & IBRD countries)Middle incomeMoldovaMontenegroMoroccoMozambiqueMyanmarNetherlandsNew ZealandNicaraguaNigerNigeriaNorth AmericaNorwayOECD membersOmanOther small statesPacific island small statesPakistanPanamaPapua New GuineaParaguayPeruPhilippinesPolandPortugalPost-demographic dividendPre-demographic dividendQatarRomaniaRussian FederationRwandaSaudi ArabiaSenegalSerbiaSeychellesSierra LeoneSingaporeSlovak RepublicSloveniaSmall statesSomaliaSouth AfricaSouth AsiaSouth Asia (IDA & IBRD)SpainSri LankaSt. LuciaSt. Vincent and the GrenadinesSub-Saharan Africa Sub-Saharan Africa (excluding high income)Sub-Saharan Africa (IDA & IBRD countries)SudanSurinameSwedenSwitzerlandSyrian Arab RepublicTanzaniaThailandTogoTrinidad and TobagoTunisiaTurkeyUgandaUkraineUnited Arab EmiratesUnited KingdomUnited StatesUpper middle incomeUruguayVenezuela, RBVietnamWorldYemen, Rep.ZambiaZimbabwe línea de tiempo (timeline):
En esta escala de tiempo se presenta un gráfico de 1961 y 2015 de Tanzania. Los datos de 1960 están ausentes. El número de observaciones reales por fecha: 55.
Fuente (nombre):
Indicadores del desarrollo mundial
Fuente (organización):
World Bank staff estimates based data from International Monetary Fund's Direction of Trade database.
Categorías:
Private Sector, Trade
Se ha actualizado:
23 abr 2017 año
Los indicadores de los cambios de valor en los últimos años
Mínimo:
0.115
1 ene 1989 año
Máximo:
23.904
1 ene 2009 año
A la fecha de observación
Valor
Cambio absoluto
El cambio con respecto al valor anterior
1 ene 1961 año
3.502
+3.502
0.0%
1 ene 1962 año
4.269
+0.767
21.91%
1 ene 1963 año
5.156
+0.887
20.77%
1 ene 1964 año
2.841
-2.315
-44.9%
1 ene 1965 año
2.075
-0.766
-26.97%
1 ene 1966 año
2.712
+0.637
30.7%
1 ene 1967 año
6.669
+3.958
145.94%
1 ene 1968 año
10.514
+3.845
57.65%
1 ene 1969 año
16.957
+6.443
61.27%
1 ene 1970 año
12.361
-4.596
-27.11%
1 ene 1971 año
16.739
+4.378
35.42%
1 ene 1972 año
21.146
+4.407
26.33%
1 ene 1973 año
20.217
-0.93
-4.4%
1 ene 1974 año
18.687
-1.529
-7.56%
1 ene 1975 año
17.637
-1.051
-5.62%
1 ene 1976 año
14.918
-2.719
-15.41%
1 ene 1977 año
9.847
-5.07
-33.99%
1 ene 1978 año
5.592
-4.256
-43.22%
1 ene 1979 año
6.935
+1.343
24.01%
1 ene 1980 año
12.45
+5.515
79.53%
1 ene 1981 año
11.66
-0.789
-6.34%
1 ene 1982 año
7.078
-4.582
-39.3%
1 ene 1983 año
5.837
-1.241
-17.54%
1 ene 1984 año
6.109
+0.273
4.68%
1 ene 1985 año
6.53
+0.421
6.89%
1 ene 1986 año
4.742
-1.788
-27.38%
1 ene 1987 año
0.983
-3.76
-79.28%
1 ene 1988 año
1.179
+0.197
20.03%
1 ene 1989 año
0.115
-1.065
-90.29%
1 ene 1990 año
1.783
+1.668
1.46 mil%
1 ene 1991 año
7.821
+6.038
338.68%
1 ene 1992 año
10.186
+2.365
30.25%
1 ene 1993 año
15.529
+5.343
52.45%
1 ene 1994 año
15.546
+0.017
0.11%
1 ene 1995 año
15.086
-0.46
-2.96%
1 ene 1996 año
14.997
-0.089
-0.59%
1 ene 1997 año
14.254
-0.742
-4.95%
1 ene 1998 año
14.605
+0.351
2.46%
1 ene 1999 año
12.623
-1.982
-13.57%
1 ene 2000 año
16.657
+4.034
31.96%
1 ene 2001 año
18.244
+1.587
9.53%
1 ene 2002 año
11.472
-6.772
-37.12%
1 ene 2003 año
13.712
+2.24
19.53%
1 ene 2004 año
16.032
+2.32
16.92%
1 ene 2005 año
15.897
-0.135
-0.84%
1 ene 2006 año
17.896
+1.999
12.57%
1 ene 2007 año
19.24
+1.344
7.51%
1 ene 2008 año
19.622
+0.383
1.99%
1 ene 2009 año
23.904
+4.281
21.82%
1 ene 2010 año
20.299
-3.605
-15.08%
1 ene 2011 año
22.802
+2.503
12.33%
1 ene 2012 año
22.683
-0.119
-0.52%
1 ene 2013 año
22.282
-0.4
-1.77%
1 ene 2014 año
20.051
-2.231
-10.01%
1 ene 2015 año
20.039
-0.012
-0.06%
Ranking de los países por los datos estadísticos actuales


Comentarios: