29
/es/
es
AIzaSyAYiBZKx7MnpbEhh9jyipgxe19OcubqV5w
April 1, 2024
285498
Zambia
ZMB
true
2
1
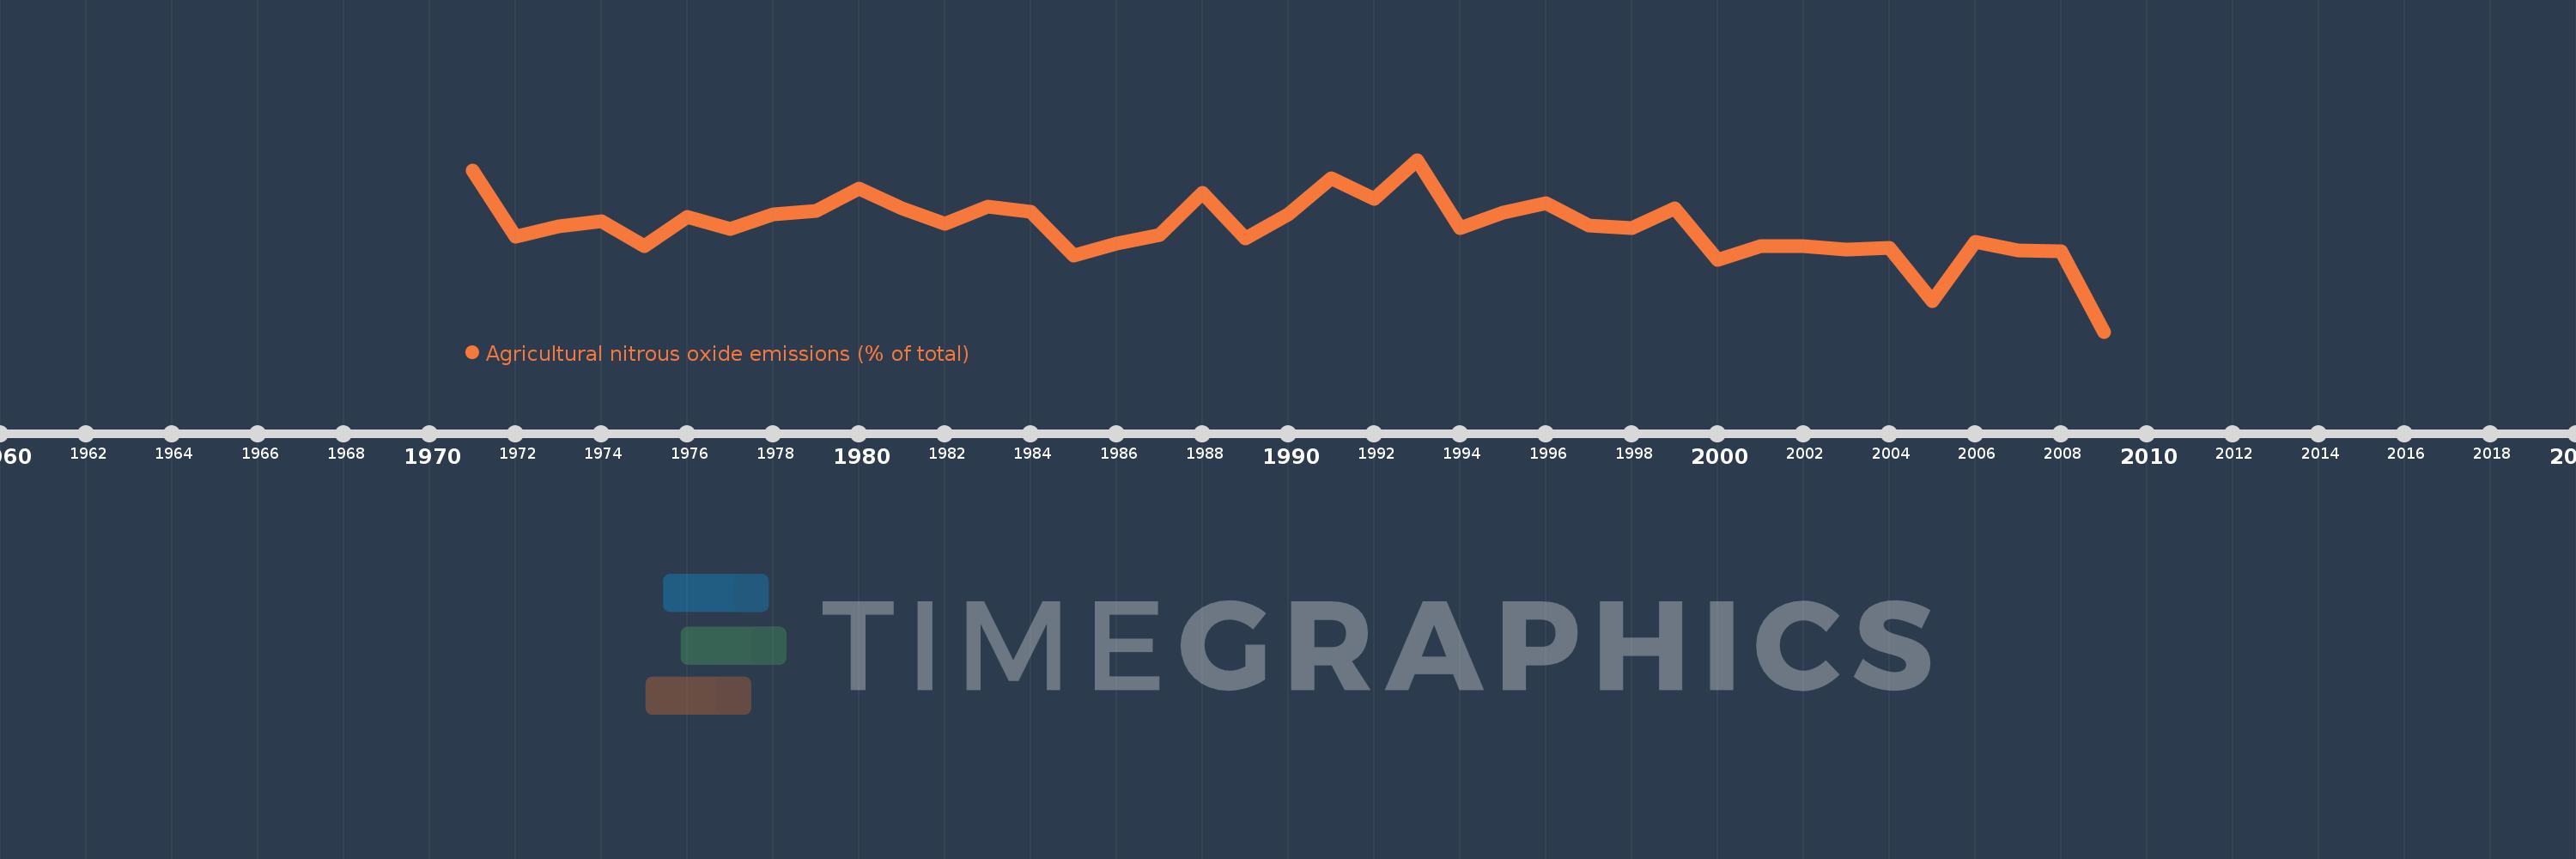
Agricultural nitrous oxide emissions (% of total)
2009,2008,2007,2006,2005,2004,2003,2002,2001,2000,1999,1998,1997,1996,1995,1994,1993,1992,1991,1990,1989,1988,1987,1986,1985,1984,1983,1982,1981,1980,1979,1978,1977,1976,1975,1974,1973,1972,1971
Estas estadísticas en otros países:
AfghanistanAlbaniaAlgeriaAmerican SamoaAndorraAngolaAntigua and BarbudaArab WorldArgentinaArmeniaArubaAustraliaAustriaAzerbaijanBahamas, TheBahrainBangladeshBarbadosBelarusBelgiumBelizeBeninBermudaBhutanBoliviaBosnia and HerzegovinaBotswanaBrazilBritish Virgin IslandsBrunei DarussalamBulgariaBurkina FasoBurundiCabo VerdeCambodiaCameroonCanadaCaribbean small statesCayman IslandsCentral African RepublicCentral Europe and the BalticsChadChileChinaColombiaComorosCongo, Dem. Rep.Congo, Rep.Costa RicaCote d'IvoireCroatiaCubaCyprusCzech RepublicDenmarkDjiboutiDominicaDominican RepublicEarly-demographic dividendEast Asia & PacificEast Asia & Pacific (excluding high income)East Asia & Pacific (IDA & IBRD countries)EcuadorEgypt, Arab Rep.El SalvadorEquatorial GuineaEritreaEstoniaEthiopiaEuro areaEurope & Central AsiaEurope & Central Asia (excluding high income)Europe & Central Asia (IDA & IBRD countries)European UnionFaroe IslandsFijiFinlandFragile and conflict affected situationsFranceFrench PolynesiaGabonGambia, TheGeorgiaGermanyGhanaGibraltarGreeceGreenlandGrenadaGuamGuatemalaGuineaGuinea-BissauGuyanaHaitiHeavily indebted poor countries (HIPC)High incomeHondurasHong Kong SAR, ChinaHungaryIBRD onlyIcelandIDA & IBRD totalIDA blendIDA onlyIDA totalIndiaIndonesiaIran, Islamic Rep.IraqIrelandIsraelItalyJamaicaJapanJordanKazakhstanKenyaKiribatiKorea, Dem. People’s Rep.Korea, Rep.KuwaitKyrgyz RepublicLao PDRLate-demographic dividendLatin America & Caribbean Latin America & Caribbean (excluding high income)Latin America & the Caribbean (IDA & IBRD countries)LatviaLeast developed countries: UN classificationLebanonLesothoLiberiaLibyaLithuaniaLow & middle incomeLow incomeLower middle incomeLuxembourgMacao SAR, ChinaMacedonia, FYRMadagascarMalawiMalaysiaMaldivesMaliMaltaMarshall IslandsMauritaniaMauritiusMexicoMicronesia, Fed. Sts.Middle East & North AfricaMiddle East & North Africa (excluding high income)Middle East & North Africa (IDA & IBRD countries)Middle incomeMoldovaMongoliaMoroccoMozambiqueMyanmarNamibiaNauruNepalNetherlandsNew CaledoniaNew ZealandNicaraguaNigerNigeriaNorth AmericaNorthern Mariana IslandsNorwayOECD membersOmanOther small statesPacific island small statesPakistanPalauPanamaPapua New GuineaParaguayPeruPhilippinesPolandPortugalPost-demographic dividendPre-demographic dividendPuerto RicoQatarRomaniaRussian FederationRwandaSamoaSao Tome and PrincipeSaudi ArabiaSenegalSerbiaSeychellesSierra LeoneSingaporeSlovak RepublicSloveniaSmall statesSolomon IslandsSomaliaSouth AfricaSouth AsiaSouth Asia (IDA & IBRD)SpainSri LankaSt. Kitts and NevisSt. LuciaSt. Vincent and the GrenadinesSub-Saharan Africa Sub-Saharan Africa (excluding high income)Sub-Saharan Africa (IDA & IBRD countries)SudanSurinameSwazilandSwedenSwitzerlandSyrian Arab RepublicTajikistanTanzaniaThailandTimor-LesteTogoTongaTrinidad and TobagoTunisiaTurkeyTurkmenistanTurks and Caicos IslandsTuvaluUgandaUkraineUnited Arab EmiratesUnited KingdomUnited StatesUpper middle incomeUruguayUzbekistanVanuatuVenezuela, RBVietnamVirgin Islands (U.S.)WorldYemen, Rep.ZambiaZimbabwe línea de tiempo (timeline):
En esta escala de tiempo se presenta un gráfico de 1971 y 2009 de Zambia. Los datos de 1970 están ausentes. El número de observaciones reales por fecha: 39.
Fuente (nombre):
Indicadores del desarrollo mundial
Fuente (organización):
World Bank staff estimates from original source: European Commission, Joint Research Centre (JRC)/Netherlands Environmental Assessment Agency (PBL). Emission Database for Global Atmospheric Research (EDGAR): http://edgar.jrc.ec.europa.eu/.
Categorías:
Agriculture & Rural Development, Environment
Se ha actualizado:
23 abr 2017 año
Los indicadores de los cambios de valor en los últimos años
Mínimo:
65.589
1 ene 2009 año
Máximo:
74.576
1 ene 1993 año
A la fecha de observación
Valor
Cambio absoluto
El cambio con respecto al valor anterior
1 ene 1971 año
73.994
+73.994
0.0%
1 ene 1972 año
70.556
-3.438
-4.65%
1 ene 1973 año
71.081
+0.525
0.74%
1 ene 1974 año
71.349
+0.269
0.38%
1 ene 1975 año
70.062
-1.287
-1.8%
1 ene 1976 año
71.586
+1.524
2.18%
1 ene 1977 año
70.979
-0.607
-0.85%
1 ene 1978 año
71.713
+0.734
1.03%
1 ene 1979 año
71.895
+0.183
0.25%
1 ene 1980 año
73.093
+1.198
1.67%
1 ene 1981 año
72.047
-1.047
-1.43%
1 ene 1982 año
71.207
-0.84
-1.17%
1 ene 1983 año
72.121
+0.914
1.28%
1 ene 1984 año
71.857
-0.264
-0.37%
1 ene 1985 año
69.578
-2.279
-3.17%
1 ene 1986 año
70.175
+0.597
0.86%
1 ene 1987 año
70.644
+0.469
0.67%
1 ene 1988 año
72.847
+2.204
3.12%
1 ene 1989 año
70.462
-2.385
-3.27%
1 ene 1990 año
71.741
+1.278
1.81%
1 ene 1991 año
73.6
+1.859
2.59%
1 ene 1992 año
72.547
-1.054
-1.43%
1 ene 1993 año
74.576
+2.029
2.8%
1 ene 1994 año
70.985
-3.591
-4.82%
1 ene 1995 año
71.825
+0.84
1.18%
1 ene 1996 año
72.304
+0.479
0.67%
1 ene 1997 año
71.148
-1.156
-1.6%
1 ene 1998 año
71.016
-0.133
-0.19%
1 ene 1999 año
72.049
+1.033
1.45%
1 ene 2000 año
69.337
-2.711
-3.76%
1 ene 2001 año
70.042
+0.705
1.02%
1 ene 2002 año
70.047
+0.005
0.01%
1 ene 2003 año
69.886
-0.161
-0.23%
1 ene 2004 año
69.972
+0.086
0.12%
1 ene 2005 año
67.193
-2.779
-3.97%
1 ene 2006 año
70.307
+3.114
4.63%
1 ene 2007 año
69.816
-0.491
-0.7%
1 ene 2008 año
69.81
-0.006
-0.01%
1 ene 2009 año
65.589
-4.221
-6.05%
Ranking de los países por los datos estadísticos actuales


Comentarios: