29
/es/
es
AIzaSyAYiBZKx7MnpbEhh9jyipgxe19OcubqV5w
April 1, 2024
138990
Germany
DEU
true
2
1
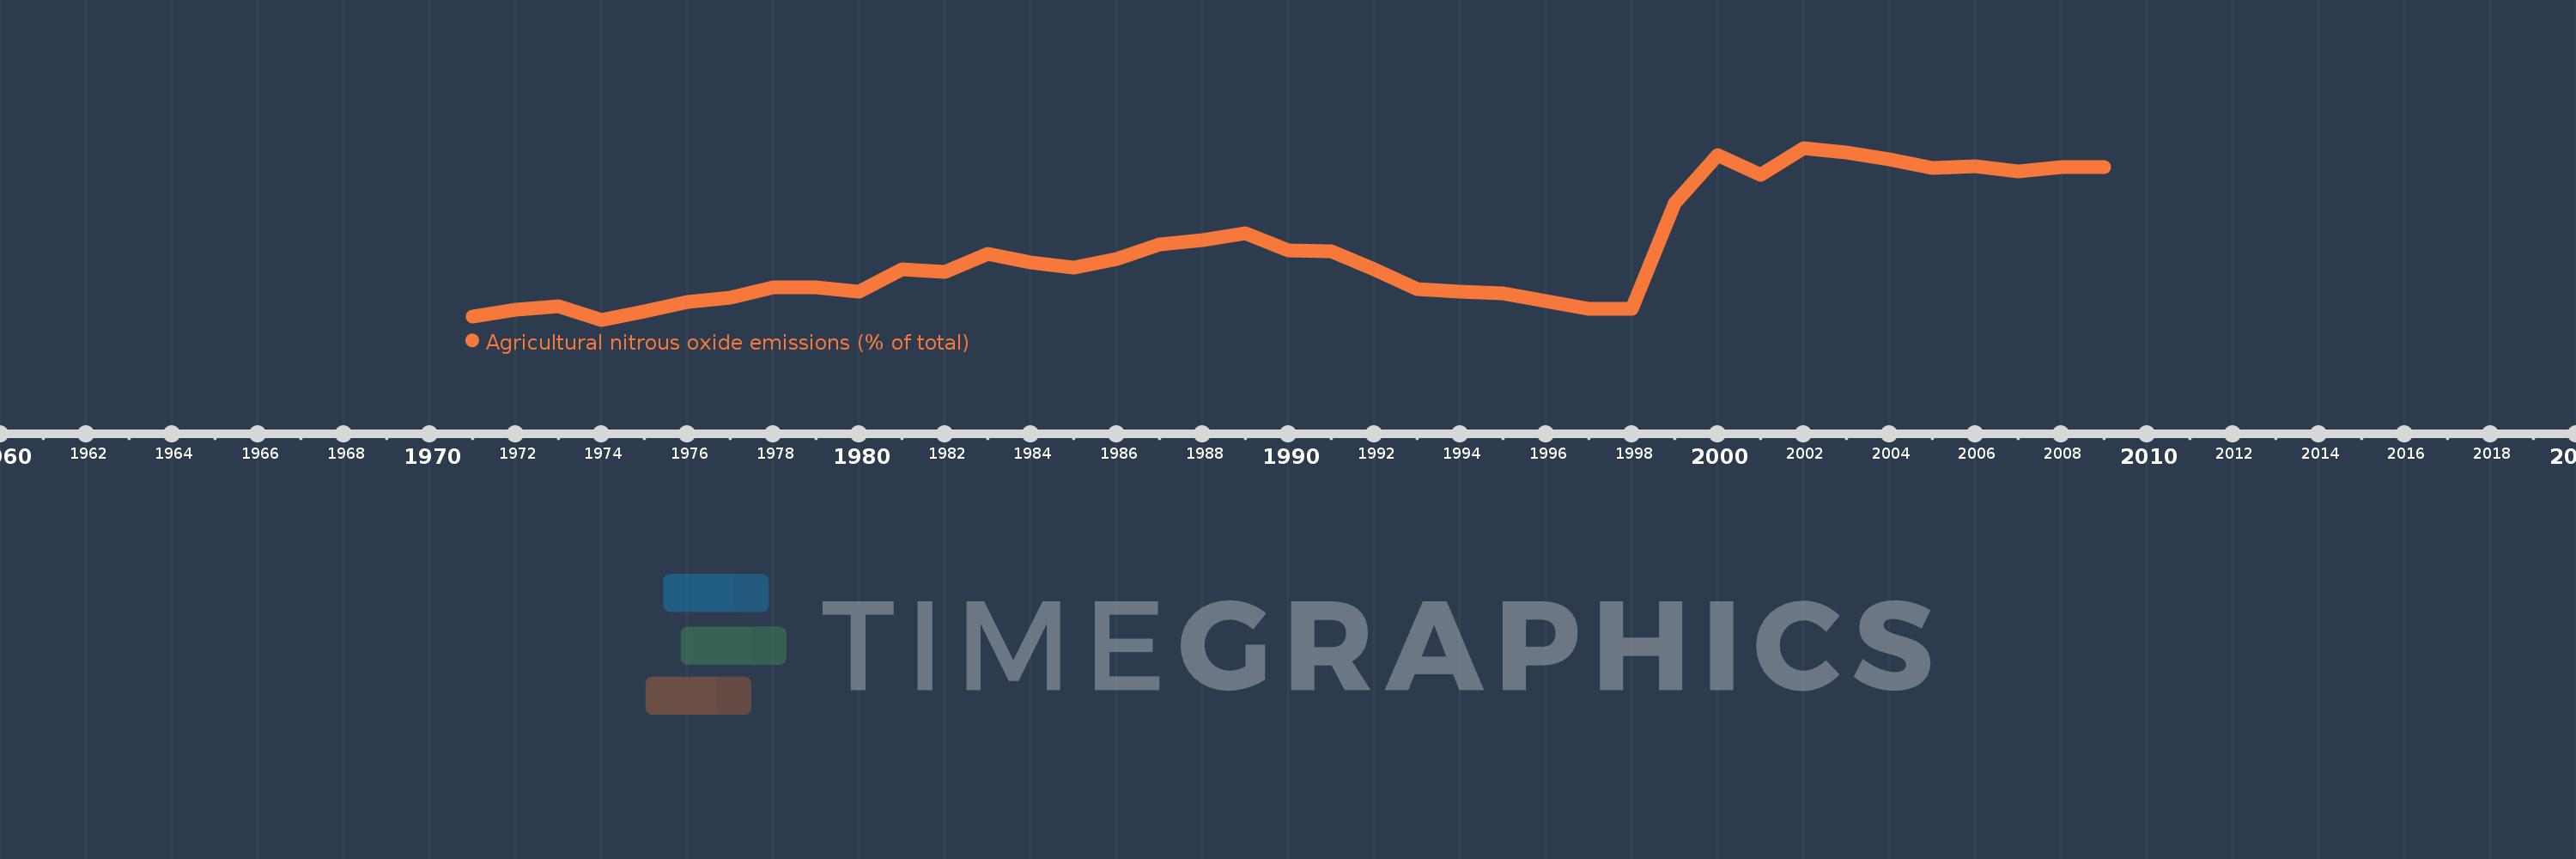
Agricultural nitrous oxide emissions (% of total)
2009,2008,2007,2006,2005,2004,2003,2002,2001,2000,1999,1998,1997,1996,1995,1994,1993,1992,1991,1990,1989,1988,1987,1986,1985,1984,1983,1982,1981,1980,1979,1978,1977,1976,1975,1974,1973,1972,1971
Estas estadísticas en otros países:
AfghanistanAlbaniaAlgeriaAmerican SamoaAndorraAngolaAntigua and BarbudaArab WorldArgentinaArmeniaArubaAustraliaAustriaAzerbaijanBahamas, TheBahrainBangladeshBarbadosBelarusBelgiumBelizeBeninBermudaBhutanBoliviaBosnia and HerzegovinaBotswanaBrazilBritish Virgin IslandsBrunei DarussalamBulgariaBurkina FasoBurundiCabo VerdeCambodiaCameroonCanadaCaribbean small statesCayman IslandsCentral African RepublicCentral Europe and the BalticsChadChileChinaColombiaComorosCongo, Dem. Rep.Congo, Rep.Costa RicaCote d'IvoireCroatiaCubaCyprusCzech RepublicDenmarkDjiboutiDominicaDominican RepublicEarly-demographic dividendEast Asia & PacificEast Asia & Pacific (excluding high income)East Asia & Pacific (IDA & IBRD countries)EcuadorEgypt, Arab Rep.El SalvadorEquatorial GuineaEritreaEstoniaEthiopiaEuro areaEurope & Central AsiaEurope & Central Asia (excluding high income)Europe & Central Asia (IDA & IBRD countries)European UnionFaroe IslandsFijiFinlandFragile and conflict affected situationsFranceFrench PolynesiaGabonGambia, TheGeorgiaGermanyGhanaGibraltarGreeceGreenlandGrenadaGuamGuatemalaGuineaGuinea-BissauGuyanaHaitiHeavily indebted poor countries (HIPC)High incomeHondurasHong Kong SAR, ChinaHungaryIBRD onlyIcelandIDA & IBRD totalIDA blendIDA onlyIDA totalIndiaIndonesiaIran, Islamic Rep.IraqIrelandIsraelItalyJamaicaJapanJordanKazakhstanKenyaKiribatiKorea, Dem. People’s Rep.Korea, Rep.KuwaitKyrgyz RepublicLao PDRLate-demographic dividendLatin America & Caribbean Latin America & Caribbean (excluding high income)Latin America & the Caribbean (IDA & IBRD countries)LatviaLeast developed countries: UN classificationLebanonLesothoLiberiaLibyaLithuaniaLow & middle incomeLow incomeLower middle incomeLuxembourgMacao SAR, ChinaMacedonia, FYRMadagascarMalawiMalaysiaMaldivesMaliMaltaMarshall IslandsMauritaniaMauritiusMexicoMicronesia, Fed. Sts.Middle East & North AfricaMiddle East & North Africa (excluding high income)Middle East & North Africa (IDA & IBRD countries)Middle incomeMoldovaMongoliaMoroccoMozambiqueMyanmarNamibiaNauruNepalNetherlandsNew CaledoniaNew ZealandNicaraguaNigerNigeriaNorth AmericaNorthern Mariana IslandsNorwayOECD membersOmanOther small statesPacific island small statesPakistanPalauPanamaPapua New GuineaParaguayPeruPhilippinesPolandPortugalPost-demographic dividendPre-demographic dividendPuerto RicoQatarRomaniaRussian FederationRwandaSamoaSao Tome and PrincipeSaudi ArabiaSenegalSerbiaSeychellesSierra LeoneSingaporeSlovak RepublicSloveniaSmall statesSolomon IslandsSomaliaSouth AfricaSouth AsiaSouth Asia (IDA & IBRD)SpainSri LankaSt. Kitts and NevisSt. LuciaSt. Vincent and the GrenadinesSub-Saharan Africa Sub-Saharan Africa (excluding high income)Sub-Saharan Africa (IDA & IBRD countries)SudanSurinameSwazilandSwedenSwitzerlandSyrian Arab RepublicTajikistanTanzaniaThailandTimor-LesteTogoTongaTrinidad and TobagoTunisiaTurkeyTurkmenistanTurks and Caicos IslandsTuvaluUgandaUkraineUnited Arab EmiratesUnited KingdomUnited StatesUpper middle incomeUruguayUzbekistanVanuatuVenezuela, RBVietnamVirgin Islands (U.S.)WorldYemen, Rep.ZambiaZimbabwe línea de tiempo (timeline):
En esta escala de tiempo se presenta un gráfico de 1971 y 2009 de Germany. Los datos de 1970 están ausentes. El número de observaciones reales por fecha: 39.
Fuente (nombre):
Indicadores del desarrollo mundial
Fuente (organización):
World Bank staff estimates from original source: European Commission, Joint Research Centre (JRC)/Netherlands Environmental Assessment Agency (PBL). Emission Database for Global Atmospheric Research (EDGAR): http://edgar.jrc.ec.europa.eu/.
Categorías:
Agriculture & Rural Development, Environment
Se ha actualizado:
23 abr 2017 año
Los indicadores de los cambios de valor en los últimos años
Mínimo:
38.972
1 ene 1974 año
Máximo:
59.792
1 ene 2002 año
A la fecha de observación
Valor
Cambio absoluto
El cambio con respecto al valor anterior
1 ene 1971 año
39.35
+39.35
0.0%
1 ene 1972 año
40.163
+0.813
2.07%
1 ene 1973 año
40.561
+0.399
0.99%
1 ene 1974 año
38.972
-1.589
-3.92%
1 ene 1975 año
39.938
+0.966
2.48%
1 ene 1976 año
41.081
+1.143
2.86%
1 ene 1977 año
41.674
+0.593
1.44%
1 ene 1978 año
42.866
+1.193
2.86%
1 ene 1979 año
42.91
+0.044
0.1%
1 ene 1980 año
42.426
-0.485
-1.13%
1 ene 1981 año
45.041
+2.616
6.17%
1 ene 1982 año
44.743
-0.299
-0.66%
1 ene 1983 año
46.982
+2.24
5.01%
1 ene 1984 año
45.94
-1.042
-2.22%
1 ene 1985 año
45.329
-0.612
-1.33%
1 ene 1986 año
46.317
+0.988
2.18%
1 ene 1987 año
48.05
+1.733
3.74%
1 ene 1988 año
48.58
+0.53
1.1%
1 ene 1989 año
49.487
+0.907
1.87%
1 ene 1990 año
47.357
-2.13
-4.3%
1 ene 1991 año
47.226
-0.131
-0.28%
1 ene 1992 año
45.104
-2.122
-4.49%
1 ene 1993 año
42.654
-2.45
-5.43%
1 ene 1994 año
42.421
-0.233
-0.55%
1 ene 1995 año
42.161
-0.261
-0.61%
1 ene 1996 año
41.259
-0.901
-2.14%
1 ene 1997 año
40.278
-0.982
-2.38%
1 ene 1998 año
40.331
+0.053
0.13%
1 ene 1999 año
53.049
+12.718
31.53%
1 ene 2000 año
58.938
+5.889
11.1%
1 ene 2001 año
56.549
-2.388
-4.05%
1 ene 2002 año
59.792
+3.243
5.74%
1 ene 2003 año
59.217
-0.576
-0.96%
1 ene 2004 año
58.38
-0.836
-1.41%
1 ene 2005 año
57.37
-1.01
-1.73%
1 ene 2006 año
57.599
+0.228
0.4%
1 ene 2007 año
56.96
-0.638
-1.11%
1 ene 2008 año
57.511
+0.551
0.97%
1 ene 2009 año
57.51
-0.001
0.0%
Ranking de los países por los datos estadísticos actuales


Comentarios: