29
/es/
es
AIzaSyAYiBZKx7MnpbEhh9jyipgxe19OcubqV5w
April 1, 2024
211331
Niger
NER
true
2
1
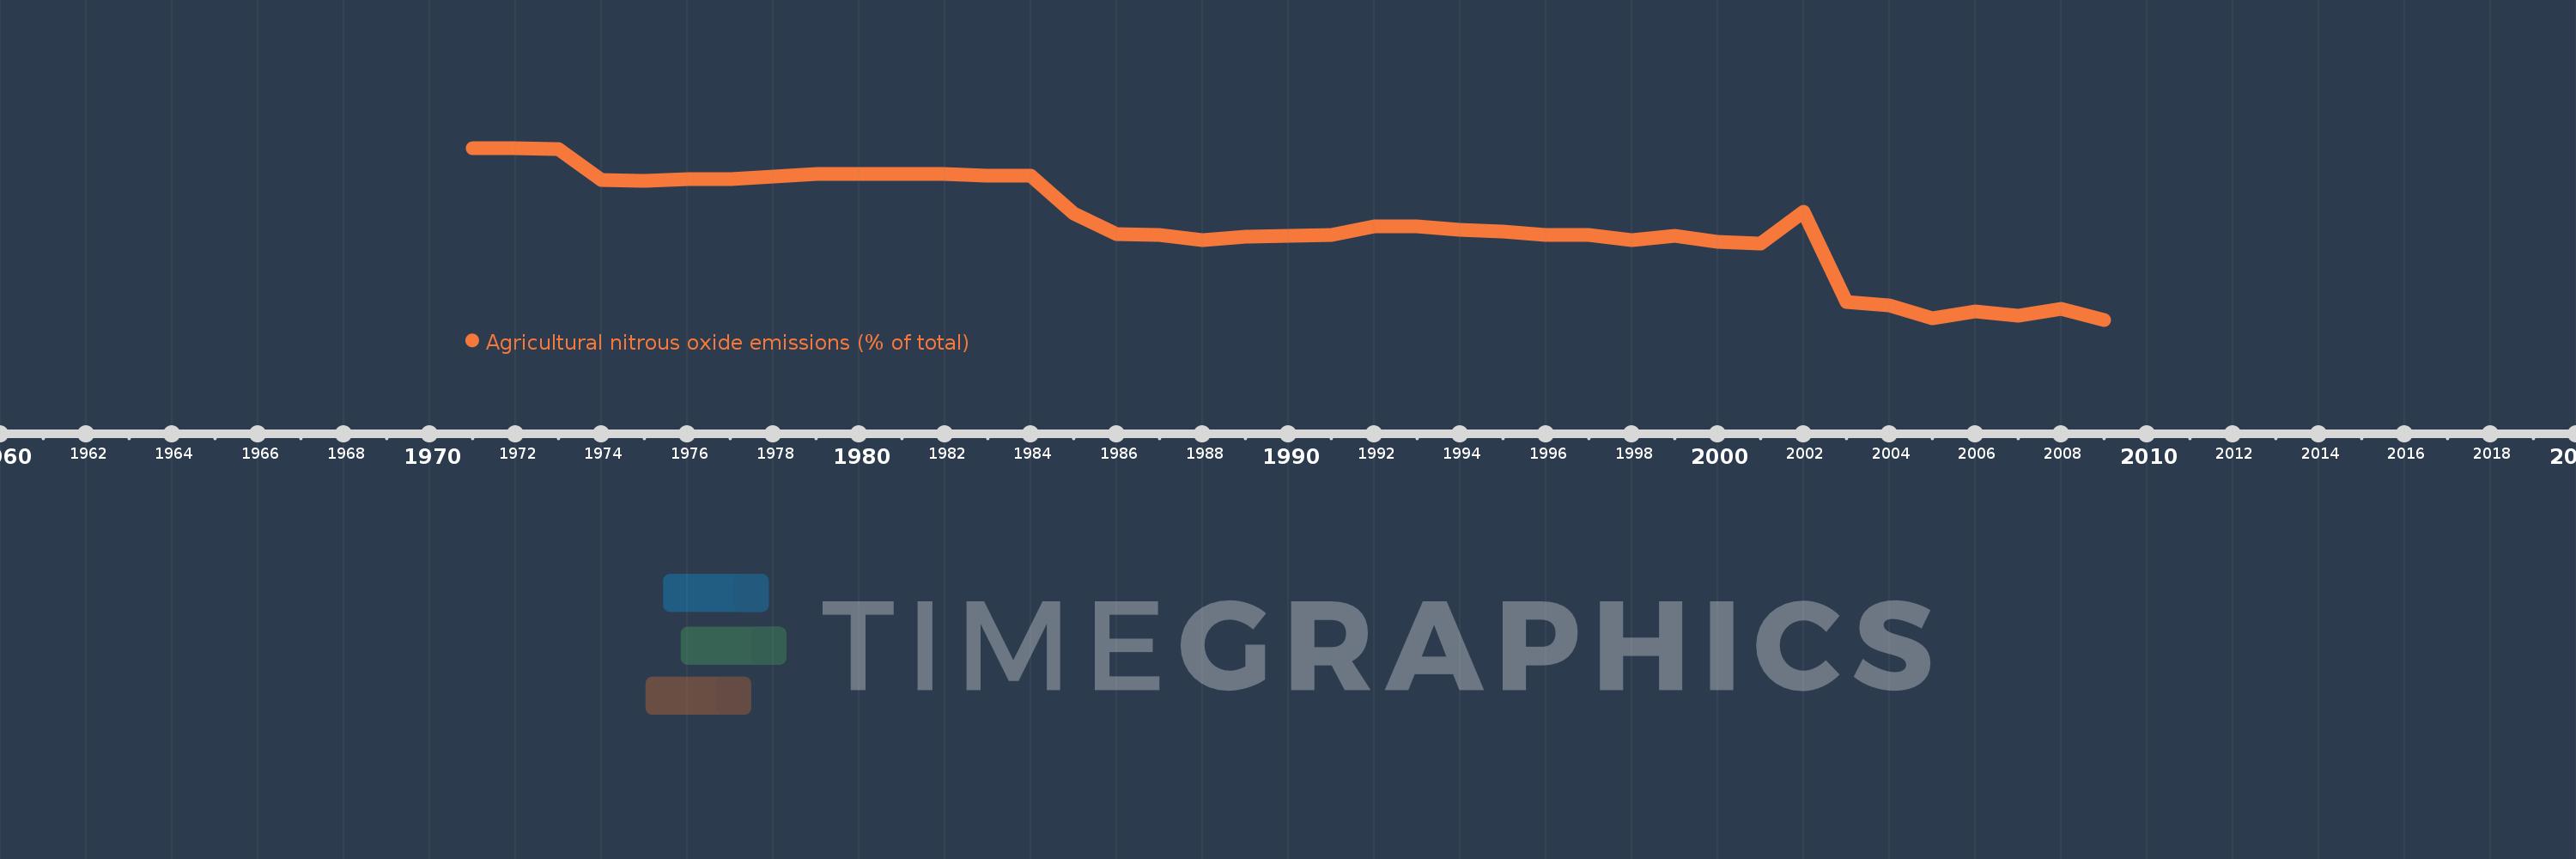
Agricultural nitrous oxide emissions (% of total)
2009,2008,2007,2006,2005,2004,2003,2002,2001,2000,1999,1998,1997,1996,1995,1994,1993,1992,1991,1990,1989,1988,1987,1986,1985,1984,1983,1982,1981,1980,1979,1978,1977,1976,1975,1974,1973,1972,1971
Estas estadísticas en otros países:
AfghanistanAlbaniaAlgeriaAmerican SamoaAndorraAngolaAntigua and BarbudaArab WorldArgentinaArmeniaArubaAustraliaAustriaAzerbaijanBahamas, TheBahrainBangladeshBarbadosBelarusBelgiumBelizeBeninBermudaBhutanBoliviaBosnia and HerzegovinaBotswanaBrazilBritish Virgin IslandsBrunei DarussalamBulgariaBurkina FasoBurundiCabo VerdeCambodiaCameroonCanadaCaribbean small statesCayman IslandsCentral African RepublicCentral Europe and the BalticsChadChileChinaColombiaComorosCongo, Dem. Rep.Congo, Rep.Costa RicaCote d'IvoireCroatiaCubaCyprusCzech RepublicDenmarkDjiboutiDominicaDominican RepublicEarly-demographic dividendEast Asia & PacificEast Asia & Pacific (excluding high income)East Asia & Pacific (IDA & IBRD countries)EcuadorEgypt, Arab Rep.El SalvadorEquatorial GuineaEritreaEstoniaEthiopiaEuro areaEurope & Central AsiaEurope & Central Asia (excluding high income)Europe & Central Asia (IDA & IBRD countries)European UnionFaroe IslandsFijiFinlandFragile and conflict affected situationsFranceFrench PolynesiaGabonGambia, TheGeorgiaGermanyGhanaGibraltarGreeceGreenlandGrenadaGuamGuatemalaGuineaGuinea-BissauGuyanaHaitiHeavily indebted poor countries (HIPC)High incomeHondurasHong Kong SAR, ChinaHungaryIBRD onlyIcelandIDA & IBRD totalIDA blendIDA onlyIDA totalIndiaIndonesiaIran, Islamic Rep.IraqIrelandIsraelItalyJamaicaJapanJordanKazakhstanKenyaKiribatiKorea, Dem. People’s Rep.Korea, Rep.KuwaitKyrgyz RepublicLao PDRLate-demographic dividendLatin America & Caribbean Latin America & Caribbean (excluding high income)Latin America & the Caribbean (IDA & IBRD countries)LatviaLeast developed countries: UN classificationLebanonLesothoLiberiaLibyaLithuaniaLow & middle incomeLow incomeLower middle incomeLuxembourgMacao SAR, ChinaMacedonia, FYRMadagascarMalawiMalaysiaMaldivesMaliMaltaMarshall IslandsMauritaniaMauritiusMexicoMicronesia, Fed. Sts.Middle East & North AfricaMiddle East & North Africa (excluding high income)Middle East & North Africa (IDA & IBRD countries)Middle incomeMoldovaMongoliaMoroccoMozambiqueMyanmarNamibiaNauruNepalNetherlandsNew CaledoniaNew ZealandNicaraguaNigerNigeriaNorth AmericaNorthern Mariana IslandsNorwayOECD membersOmanOther small statesPacific island small statesPakistanPalauPanamaPapua New GuineaParaguayPeruPhilippinesPolandPortugalPost-demographic dividendPre-demographic dividendPuerto RicoQatarRomaniaRussian FederationRwandaSamoaSao Tome and PrincipeSaudi ArabiaSenegalSerbiaSeychellesSierra LeoneSingaporeSlovak RepublicSloveniaSmall statesSolomon IslandsSomaliaSouth AfricaSouth AsiaSouth Asia (IDA & IBRD)SpainSri LankaSt. Kitts and NevisSt. LuciaSt. Vincent and the GrenadinesSub-Saharan Africa Sub-Saharan Africa (excluding high income)Sub-Saharan Africa (IDA & IBRD countries)SudanSurinameSwazilandSwedenSwitzerlandSyrian Arab RepublicTajikistanTanzaniaThailandTimor-LesteTogoTongaTrinidad and TobagoTunisiaTurkeyTurkmenistanTurks and Caicos IslandsTuvaluUgandaUkraineUnited Arab EmiratesUnited KingdomUnited StatesUpper middle incomeUruguayUzbekistanVanuatuVenezuela, RBVietnamVirgin Islands (U.S.)WorldYemen, Rep.ZambiaZimbabwe línea de tiempo (timeline):
En esta escala de tiempo se presenta un gráfico de 1971 y 2009 de Niger. Los datos de 1970 están ausentes. El número de observaciones reales por fecha: 39.
Fuente (nombre):
Indicadores del desarrollo mundial
Fuente (organización):
World Bank staff estimates from original source: European Commission, Joint Research Centre (JRC)/Netherlands Environmental Assessment Agency (PBL). Emission Database for Global Atmospheric Research (EDGAR): http://edgar.jrc.ec.europa.eu/.
Categorías:
Agriculture & Rural Development, Environment
Se ha actualizado:
23 abr 2017 año
Los indicadores de los cambios de valor en los últimos años
Mínimo:
78.585
1 ene 2009 año
Máximo:
95.012
1 ene 1971 año
A la fecha de observación
Valor
Cambio absoluto
El cambio con respecto al valor anterior
1 ene 1971 año
95.012
+95.012
0.0%
1 ene 1972 año
94.965
-0.047
-0.05%
1 ene 1973 año
94.904
-0.061
-0.06%
1 ene 1974 año
91.948
-2.956
-3.11%
1 ene 1975 año
91.86
-0.089
-0.1%
1 ene 1976 año
91.994
+0.135
0.15%
1 ene 1977 año
92.038
+0.043
0.05%
1 ene 1978 año
92.298
+0.261
0.28%
1 ene 1979 año
92.558
+0.259
0.28%
1 ene 1980 año
92.546
-0.012
-0.01%
1 ene 1981 año
92.504
-0.042
-0.05%
1 ene 1982 año
92.51
+0.006
0.01%
1 ene 1983 año
92.349
-0.161
-0.17%
1 ene 1984 año
92.395
+0.047
0.05%
1 ene 1985 año
88.769
-3.626
-3.92%
1 ene 1986 año
86.808
-1.961
-2.21%
1 ene 1987 año
86.692
-0.116
-0.13%
1 ene 1988 año
86.192
-0.5
-0.58%
1 ene 1989 año
86.529
+0.337
0.39%
1 ene 1990 año
86.579
+0.05
0.06%
1 ene 1991 año
86.726
+0.147
0.17%
1 ene 1992 año
87.492
+0.767
0.88%
1 ene 1993 año
87.477
-0.015
-0.02%
1 ene 1994 año
87.204
-0.272
-0.31%
1 ene 1995 año
87.052
-0.153
-0.18%
1 ene 1996 año
86.705
-0.347
-0.4%
1 ene 1997 año
86.727
+0.022
0.03%
1 ene 1998 año
86.163
-0.563
-0.65%
1 ene 1999 año
86.572
+0.409
0.47%
1 ene 2000 año
86.029
-0.543
-0.63%
1 ene 2001 año
85.869
-0.16
-0.19%
1 ene 2002 año
88.879
+3.01
3.51%
1 ene 2003 año
80.317
-8.562
-9.63%
1 ene 2004 año
79.941
-0.376
-0.47%
1 ene 2005 año
78.702
-1.239
-1.55%
1 ene 2006 año
79.369
+0.667
0.85%
1 ene 2007 año
78.93
-0.439
-0.55%
1 ene 2008 año
79.629
+0.699
0.89%
1 ene 2009 año
78.585
-1.044
-1.31%
Ranking de los países por los datos estadísticos actuales


Comentarios: