29
/es/
es
AIzaSyAYiBZKx7MnpbEhh9jyipgxe19OcubqV5w
April 1, 2024
233364
Sao Tome and Principe
STP
true
2
1
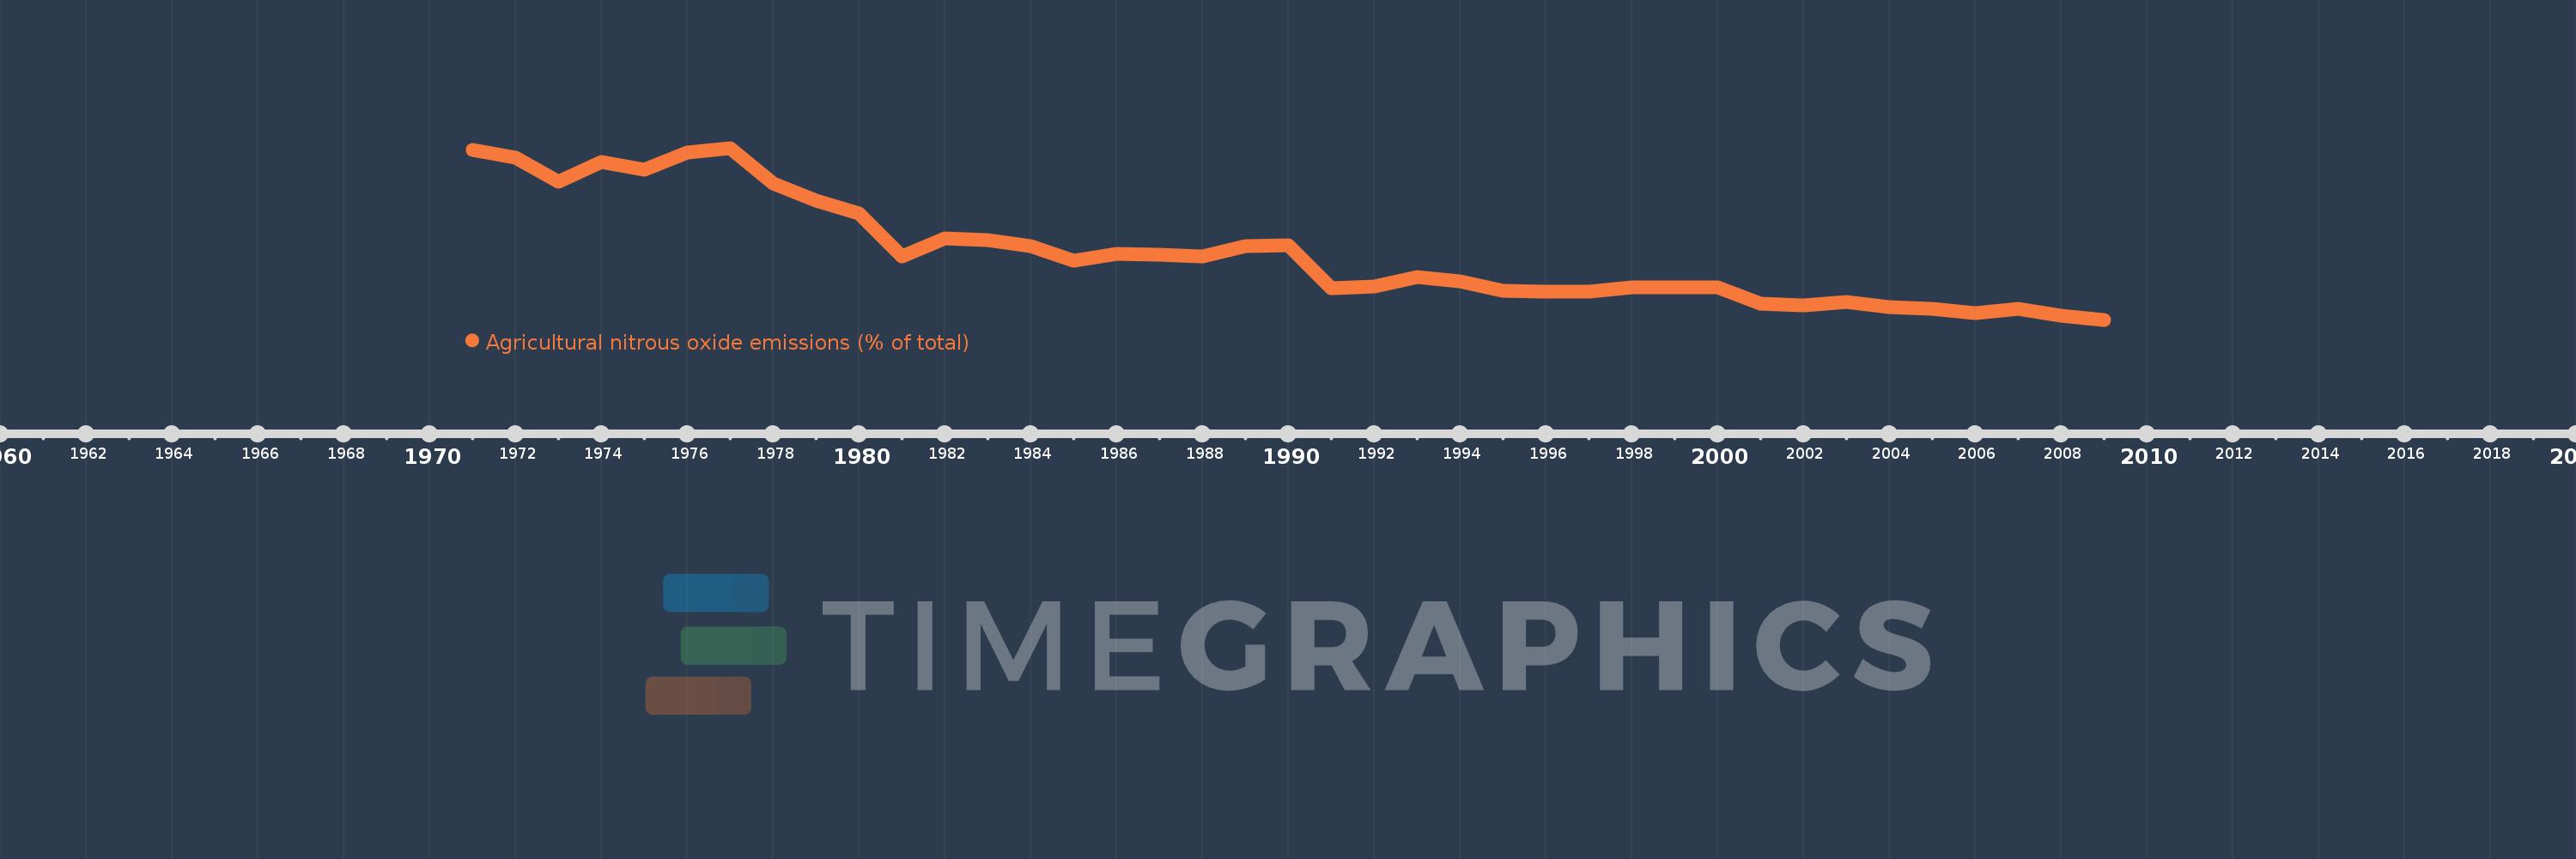
Agricultural nitrous oxide emissions (% of total)
2009,2008,2007,2006,2005,2004,2003,2002,2001,2000,1999,1998,1997,1996,1995,1994,1993,1992,1991,1990,1989,1988,1987,1986,1985,1984,1983,1982,1981,1980,1979,1978,1977,1976,1975,1974,1973,1972,1971
Estas estadísticas en otros países:
AfghanistanAlbaniaAlgeriaAmerican SamoaAndorraAngolaAntigua and BarbudaArab WorldArgentinaArmeniaArubaAustraliaAustriaAzerbaijanBahamas, TheBahrainBangladeshBarbadosBelarusBelgiumBelizeBeninBermudaBhutanBoliviaBosnia and HerzegovinaBotswanaBrazilBritish Virgin IslandsBrunei DarussalamBulgariaBurkina FasoBurundiCabo VerdeCambodiaCameroonCanadaCaribbean small statesCayman IslandsCentral African RepublicCentral Europe and the BalticsChadChileChinaColombiaComorosCongo, Dem. Rep.Congo, Rep.Costa RicaCote d'IvoireCroatiaCubaCyprusCzech RepublicDenmarkDjiboutiDominicaDominican RepublicEarly-demographic dividendEast Asia & PacificEast Asia & Pacific (excluding high income)East Asia & Pacific (IDA & IBRD countries)EcuadorEgypt, Arab Rep.El SalvadorEquatorial GuineaEritreaEstoniaEthiopiaEuro areaEurope & Central AsiaEurope & Central Asia (excluding high income)Europe & Central Asia (IDA & IBRD countries)European UnionFaroe IslandsFijiFinlandFragile and conflict affected situationsFranceFrench PolynesiaGabonGambia, TheGeorgiaGermanyGhanaGibraltarGreeceGreenlandGrenadaGuamGuatemalaGuineaGuinea-BissauGuyanaHaitiHeavily indebted poor countries (HIPC)High incomeHondurasHong Kong SAR, ChinaHungaryIBRD onlyIcelandIDA & IBRD totalIDA blendIDA onlyIDA totalIndiaIndonesiaIran, Islamic Rep.IraqIrelandIsraelItalyJamaicaJapanJordanKazakhstanKenyaKiribatiKorea, Dem. People’s Rep.Korea, Rep.KuwaitKyrgyz RepublicLao PDRLate-demographic dividendLatin America & Caribbean Latin America & Caribbean (excluding high income)Latin America & the Caribbean (IDA & IBRD countries)LatviaLeast developed countries: UN classificationLebanonLesothoLiberiaLibyaLithuaniaLow & middle incomeLow incomeLower middle incomeLuxembourgMacao SAR, ChinaMacedonia, FYRMadagascarMalawiMalaysiaMaldivesMaliMaltaMarshall IslandsMauritaniaMauritiusMexicoMicronesia, Fed. Sts.Middle East & North AfricaMiddle East & North Africa (excluding high income)Middle East & North Africa (IDA & IBRD countries)Middle incomeMoldovaMongoliaMoroccoMozambiqueMyanmarNamibiaNauruNepalNetherlandsNew CaledoniaNew ZealandNicaraguaNigerNigeriaNorth AmericaNorthern Mariana IslandsNorwayOECD membersOmanOther small statesPacific island small statesPakistanPalauPanamaPapua New GuineaParaguayPeruPhilippinesPolandPortugalPost-demographic dividendPre-demographic dividendPuerto RicoQatarRomaniaRussian FederationRwandaSamoaSao Tome and PrincipeSaudi ArabiaSenegalSerbiaSeychellesSierra LeoneSingaporeSlovak RepublicSloveniaSmall statesSolomon IslandsSomaliaSouth AfricaSouth AsiaSouth Asia (IDA & IBRD)SpainSri LankaSt. Kitts and NevisSt. LuciaSt. Vincent and the GrenadinesSub-Saharan Africa Sub-Saharan Africa (excluding high income)Sub-Saharan Africa (IDA & IBRD countries)SudanSurinameSwazilandSwedenSwitzerlandSyrian Arab RepublicTajikistanTanzaniaThailandTimor-LesteTogoTongaTrinidad and TobagoTunisiaTurkeyTurkmenistanTurks and Caicos IslandsTuvaluUgandaUkraineUnited Arab EmiratesUnited KingdomUnited StatesUpper middle incomeUruguayUzbekistanVanuatuVenezuela, RBVietnamVirgin Islands (U.S.)WorldYemen, Rep.ZambiaZimbabwe línea de tiempo (timeline):
En esta escala de tiempo se presenta un gráfico de 1971 y 2009 de Sao Tome and Principe. Los datos de 1970 están ausentes. El número de observaciones reales por fecha: 39.
Fuente (nombre):
Indicadores del desarrollo mundial
Fuente (organización):
World Bank staff estimates from original source: European Commission, Joint Research Centre (JRC)/Netherlands Environmental Assessment Agency (PBL). Emission Database for Global Atmospheric Research (EDGAR): http://edgar.jrc.ec.europa.eu/.
Categorías:
Agriculture & Rural Development, Environment
Se ha actualizado:
23 abr 2017 año
Los indicadores de los cambios de valor en los últimos años
Mínimo:
50.842
1 ene 2009 año
Máximo:
71.623
1 ene 1977 año
A la fecha de observación
Valor
Cambio absoluto
El cambio con respecto al valor anterior
1 ene 1971 año
71.409
+71.409
0.0%
1 ene 1972 año
70.484
-0.926
-1.3%
1 ene 1973 año
67.576
-2.908
-4.13%
1 ene 1974 año
69.957
+2.381
3.52%
1 ene 1975 año
68.955
-1.002
-1.43%
1 ene 1976 año
71.096
+2.141
3.1%
1 ene 1977 año
71.623
+0.526
0.74%
1 ene 1978 año
67.285
-4.338
-6.06%
1 ene 1979 año
65.269
-2.016
-3.0%
1 ene 1980 año
63.67
-1.599
-2.45%
1 ene 1981 año
58.509
-5.16
-8.11%
1 ene 1982 año
60.678
+2.168
3.71%
1 ene 1983 año
60.514
-0.163
-0.27%
1 ene 1984 año
59.711
-0.803
-1.33%
1 ene 1985 año
57.995
-1.717
-2.87%
1 ene 1986 año
58.774
+0.779
1.34%
1 ene 1987 año
58.737
-0.037
-0.06%
1 ene 1988 año
58.531
-0.206
-0.35%
1 ene 1989 año
59.699
+1.169
2.0%
1 ene 1990 año
59.892
+0.193
0.32%
1 ene 1991 año
54.689
-5.204
-8.69%
1 ene 1992 año
54.821
+0.132
0.24%
1 ene 1993 año
55.957
+1.136
2.07%
1 ene 1994 año
55.462
-0.496
-0.89%
1 ene 1995 año
54.344
-1.118
-2.02%
1 ene 1996 año
54.22
-0.124
-0.23%
1 ene 1997 año
54.237
+0.017
0.03%
1 ene 1998 año
54.775
+0.538
0.99%
1 ene 1999 año
54.777
+0.001
0.0%
1 ene 2000 año
54.744
-0.033
-0.06%
1 ene 2001 año
52.818
-1.926
-3.52%
1 ene 2002 año
52.615
-0.203
-0.38%
1 ene 2003 año
52.949
+0.334
0.64%
1 ene 2004 año
52.391
-0.559
-1.06%
1 ene 2005 año
52.136
-0.255
-0.49%
1 ene 2006 año
51.6
-0.536
-1.03%
1 ene 2007 año
52.198
+0.598
1.16%
1 ene 2008 año
51.372
-0.826
-1.58%
1 ene 2009 año
50.842
-0.53
-1.03%
Ranking de los países por los datos estadísticos actuales


Comentarios: