29
/es/
es
AIzaSyAYiBZKx7MnpbEhh9jyipgxe19OcubqV5w
April 1, 2024
263201
Timor-Leste
TLS
true
2
1
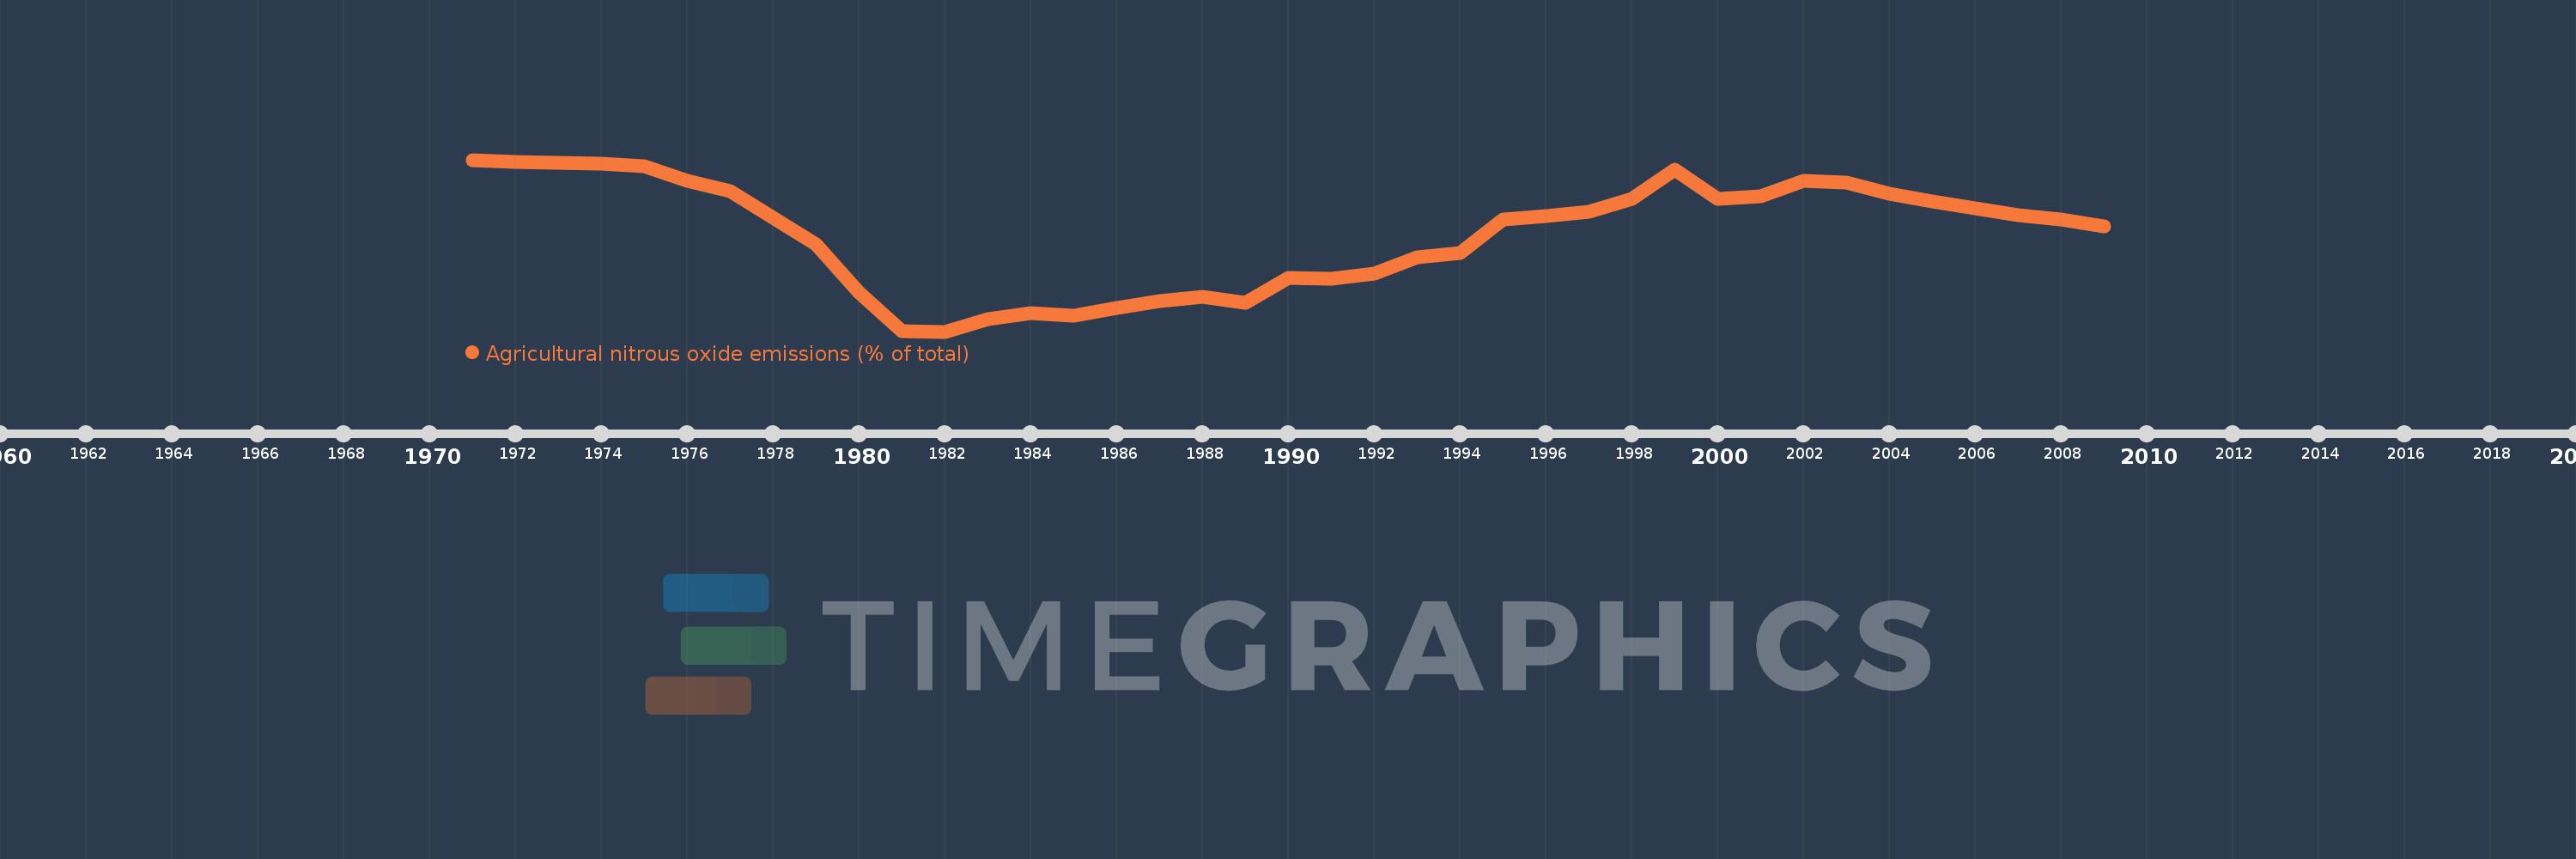
Agricultural nitrous oxide emissions (% of total)
2009,2008,2007,2006,2005,2004,2003,2002,2001,2000,1999,1998,1997,1996,1995,1994,1993,1992,1991,1990,1989,1988,1987,1986,1985,1984,1983,1982,1981,1980,1979,1978,1977,1976,1975,1974,1973,1972,1971
Estas estadísticas en otros países:
AfghanistanAlbaniaAlgeriaAmerican SamoaAndorraAngolaAntigua and BarbudaArab WorldArgentinaArmeniaArubaAustraliaAustriaAzerbaijanBahamas, TheBahrainBangladeshBarbadosBelarusBelgiumBelizeBeninBermudaBhutanBoliviaBosnia and HerzegovinaBotswanaBrazilBritish Virgin IslandsBrunei DarussalamBulgariaBurkina FasoBurundiCabo VerdeCambodiaCameroonCanadaCaribbean small statesCayman IslandsCentral African RepublicCentral Europe and the BalticsChadChileChinaColombiaComorosCongo, Dem. Rep.Congo, Rep.Costa RicaCote d'IvoireCroatiaCubaCyprusCzech RepublicDenmarkDjiboutiDominicaDominican RepublicEarly-demographic dividendEast Asia & PacificEast Asia & Pacific (excluding high income)East Asia & Pacific (IDA & IBRD countries)EcuadorEgypt, Arab Rep.El SalvadorEquatorial GuineaEritreaEstoniaEthiopiaEuro areaEurope & Central AsiaEurope & Central Asia (excluding high income)Europe & Central Asia (IDA & IBRD countries)European UnionFaroe IslandsFijiFinlandFragile and conflict affected situationsFranceFrench PolynesiaGabonGambia, TheGeorgiaGermanyGhanaGibraltarGreeceGreenlandGrenadaGuamGuatemalaGuineaGuinea-BissauGuyanaHaitiHeavily indebted poor countries (HIPC)High incomeHondurasHong Kong SAR, ChinaHungaryIBRD onlyIcelandIDA & IBRD totalIDA blendIDA onlyIDA totalIndiaIndonesiaIran, Islamic Rep.IraqIrelandIsraelItalyJamaicaJapanJordanKazakhstanKenyaKiribatiKorea, Dem. People’s Rep.Korea, Rep.KuwaitKyrgyz RepublicLao PDRLate-demographic dividendLatin America & Caribbean Latin America & Caribbean (excluding high income)Latin America & the Caribbean (IDA & IBRD countries)LatviaLeast developed countries: UN classificationLebanonLesothoLiberiaLibyaLithuaniaLow & middle incomeLow incomeLower middle incomeLuxembourgMacao SAR, ChinaMacedonia, FYRMadagascarMalawiMalaysiaMaldivesMaliMaltaMarshall IslandsMauritaniaMauritiusMexicoMicronesia, Fed. Sts.Middle East & North AfricaMiddle East & North Africa (excluding high income)Middle East & North Africa (IDA & IBRD countries)Middle incomeMoldovaMongoliaMoroccoMozambiqueMyanmarNamibiaNauruNepalNetherlandsNew CaledoniaNew ZealandNicaraguaNigerNigeriaNorth AmericaNorthern Mariana IslandsNorwayOECD membersOmanOther small statesPacific island small statesPakistanPalauPanamaPapua New GuineaParaguayPeruPhilippinesPolandPortugalPost-demographic dividendPre-demographic dividendPuerto RicoQatarRomaniaRussian FederationRwandaSamoaSao Tome and PrincipeSaudi ArabiaSenegalSerbiaSeychellesSierra LeoneSingaporeSlovak RepublicSloveniaSmall statesSolomon IslandsSomaliaSouth AfricaSouth AsiaSouth Asia (IDA & IBRD)SpainSri LankaSt. Kitts and NevisSt. LuciaSt. Vincent and the GrenadinesSub-Saharan Africa Sub-Saharan Africa (excluding high income)Sub-Saharan Africa (IDA & IBRD countries)SudanSurinameSwazilandSwedenSwitzerlandSyrian Arab RepublicTajikistanTanzaniaThailandTimor-LesteTogoTongaTrinidad and TobagoTunisiaTurkeyTurkmenistanTurks and Caicos IslandsTuvaluUgandaUkraineUnited Arab EmiratesUnited KingdomUnited StatesUpper middle incomeUruguayUzbekistanVanuatuVenezuela, RBVietnamVirgin Islands (U.S.)WorldYemen, Rep.ZambiaZimbabwe línea de tiempo (timeline):
En esta escala de tiempo se presenta un gráfico de 1971 y 2009 de Timor-Leste. Los datos de 1970 están ausentes. El número de observaciones reales por fecha: 39.
Fuente (nombre):
Indicadores del desarrollo mundial
Fuente (organización):
World Bank staff estimates from original source: European Commission, Joint Research Centre (JRC)/Netherlands Environmental Assessment Agency (PBL). Emission Database for Global Atmospheric Research (EDGAR): http://edgar.jrc.ec.europa.eu/.
Categorías:
Agriculture & Rural Development, Environment
Se ha actualizado:
23 abr 2017 año
Los indicadores de los cambios de valor en los últimos años
Mínimo:
82.033
1 ene 1982 año
Máximo:
91.789
1 ene 1971 año
A la fecha de observación
Valor
Cambio absoluto
El cambio con respecto al valor anterior
1 ene 1971 año
91.789
+91.789
0.0%
1 ene 1972 año
91.673
-0.116
-0.13%
1 ene 1973 año
91.607
-0.067
-0.07%
1 ene 1974 año
91.587
-0.02
-0.02%
1 ene 1975 año
91.432
-0.154
-0.17%
1 ene 1976 año
90.608
-0.824
-0.9%
1 ene 1977 año
90.005
-0.604
-0.67%
1 ene 1978 año
88.482
-1.523
-1.69%
1 ene 1979 año
86.99
-1.492
-1.69%
1 ene 1980 año
84.248
-2.742
-3.15%
1 ene 1981 año
82.071
-2.177
-2.58%
1 ene 1982 año
82.033
-0.038
-0.05%
1 ene 1983 año
82.755
+0.723
0.88%
1 ene 1984 año
83.082
+0.327
0.4%
1 ene 1985 año
82.941
-0.141
-0.17%
1 ene 1986 año
83.388
+0.446
0.54%
1 ene 1987 año
83.772
+0.384
0.46%
1 ene 1988 año
83.986
+0.215
0.26%
1 ene 1989 año
83.683
-0.303
-0.36%
1 ene 1990 año
85.095
+1.412
1.69%
1 ene 1991 año
85.039
-0.056
-0.07%
1 ene 1992 año
85.332
+0.293
0.34%
1 ene 1993 año
86.256
+0.924
1.08%
1 ene 1994 año
86.496
+0.24
0.28%
1 ene 1995 año
88.418
+1.922
2.22%
1 ene 1996 año
88.614
+0.196
0.22%
1 ene 1997 año
88.837
+0.222
0.25%
1 ene 1998 año
89.566
+0.73
0.82%
1 ene 1999 año
91.216
+1.649
1.84%
1 ene 2000 año
89.579
-1.637
-1.79%
1 ene 2001 año
89.738
+0.159
0.18%
1 ene 2002 año
90.583
+0.845
0.94%
1 ene 2003 año
90.473
-0.11
-0.12%
1 ene 2004 año
89.864
-0.609
-0.67%
1 ene 2005 año
89.443
-0.421
-0.47%
1 ene 2006 año
89.055
-0.387
-0.43%
1 ene 2007 año
88.649
-0.407
-0.46%
1 ene 2008 año
88.399
-0.249
-0.28%
1 ene 2009 año
88.03
-0.369
-0.42%
Ranking de los países por los datos estadísticos actuales


Comentarios: