29
/es/
es
AIzaSyAYiBZKx7MnpbEhh9jyipgxe19OcubqV5w
April 1, 2024
256366
Sweden
SWE
true
2
1
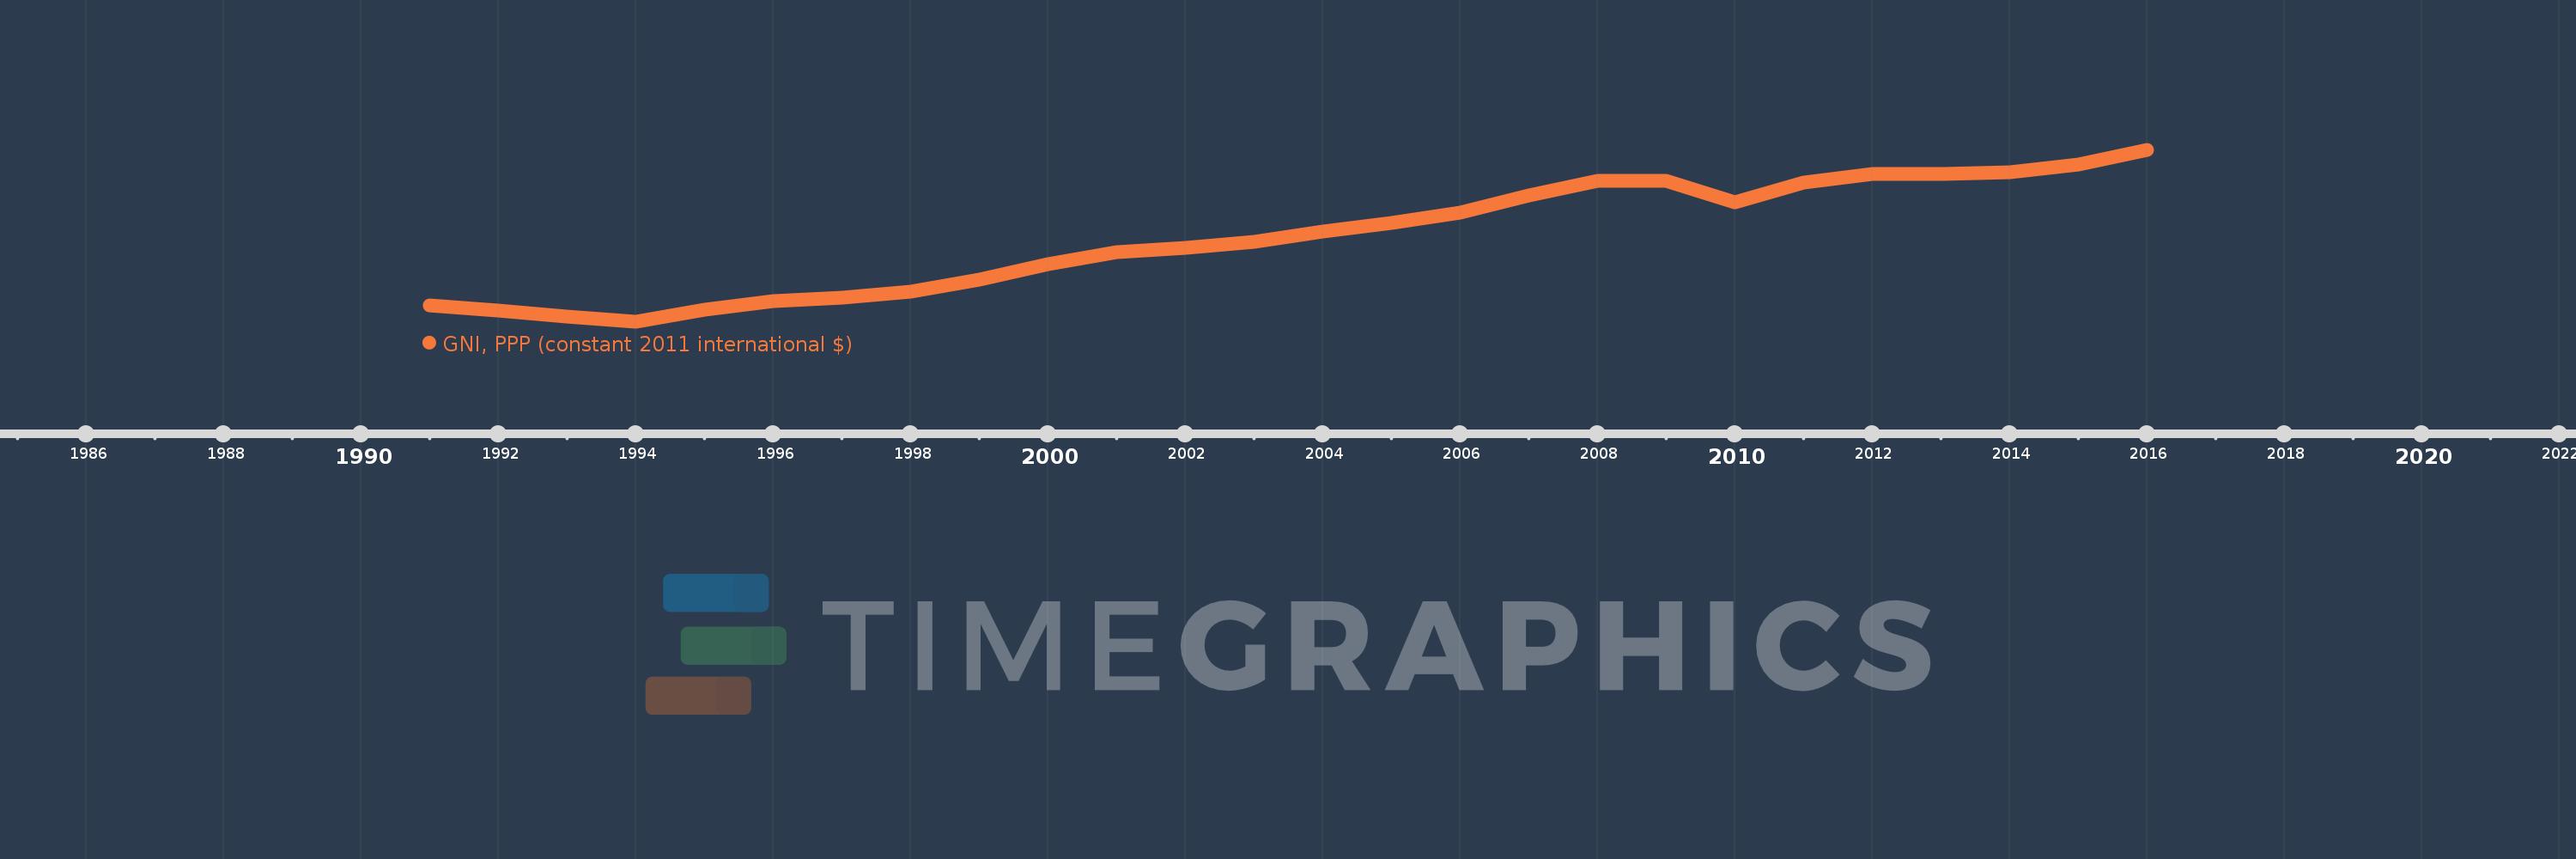
GNI, PPP (constant 2011 international $)
2016,2015,2014,2013,2012,2011,2010,2009,2008,2007,2006,2005,2004,2003,2002,2001,2000,1999,1998,1997,1996,1995,1994,1993,1992,1991
Estas estadísticas en otros países:
AfghanistanAlbaniaAlgeriaAngolaAntigua and BarbudaArab WorldArgentinaArmeniaAustraliaAustriaAzerbaijanBahamas, TheBahrainBangladeshBarbadosBelarusBelgiumBelizeBeninBermudaBhutanBoliviaBosnia and HerzegovinaBotswanaBrazilBrunei DarussalamBulgariaBurkina FasoBurundiCabo VerdeCambodiaCameroonCanadaCaribbean small statesCentral African RepublicCentral Europe and the BalticsChadChileChinaColombiaComorosCongo, Dem. Rep.Congo, Rep.Costa RicaCote d'IvoireCroatiaCubaCyprusCzech RepublicDenmarkDominicaDominican RepublicEarly-demographic dividendEast Asia & PacificEast Asia & Pacific (excluding high income)East Asia & Pacific (IDA & IBRD countries)EcuadorEgypt, Arab Rep.El SalvadorEquatorial GuineaEritreaEstoniaEthiopiaEuro areaEurope & Central AsiaEurope & Central Asia (excluding high income)Europe & Central Asia (IDA & IBRD countries)European UnionFijiFinlandFranceGabonGambia, TheGeorgiaGermanyGhanaGreeceGrenadaGuatemalaGuineaGuinea-BissauGuyanaHaitiHeavily indebted poor countries (HIPC)High incomeHondurasHong Kong SAR, ChinaHungaryIBRD onlyIcelandIDA & IBRD totalIDA blendIDA onlyIDA totalIndiaIndonesiaIran, Islamic Rep.IraqIrelandIsraelItalyJamaicaJapanJordanKazakhstanKenyaKiribatiKorea, Rep.KosovoKuwaitKyrgyz RepublicLao PDRLate-demographic dividendLatin America & Caribbean Latin America & Caribbean (excluding high income)Latin America & the Caribbean (IDA & IBRD countries)LatviaLeast developed countries: UN classificationLebanonLesothoLiberiaLibyaLithuaniaLow & middle incomeLow incomeLower middle incomeLuxembourgMacao SAR, ChinaMacedonia, FYRMadagascarMalawiMalaysiaMaldivesMaliMaltaMarshall IslandsMauritaniaMauritiusMexicoMicronesia, Fed. Sts.Middle East & North AfricaMiddle East & North Africa (excluding high income)Middle East & North Africa (IDA & IBRD countries)Middle incomeMoldovaMongoliaMontenegroMoroccoMozambiqueMyanmarNamibiaNauruNepalNetherlandsNew ZealandNicaraguaNigerNigeriaNorth AmericaNorwayOECD membersOmanOther small statesPakistanPalauPanamaPapua New GuineaParaguayPeruPhilippinesPolandPortugalPost-demographic dividendPre-demographic dividendPuerto RicoQatarRomaniaRussian FederationRwandaSamoaSao Tome and PrincipeSaudi ArabiaSenegalSerbiaSeychellesSierra LeoneSingaporeSlovak RepublicSloveniaSmall statesSolomon IslandsSouth AfricaSouth AsiaSouth Asia (IDA & IBRD)South SudanSpainSri LankaSt. Kitts and NevisSt. LuciaSt. Vincent and the GrenadinesSub-Saharan Africa Sub-Saharan Africa (excluding high income)Sub-Saharan Africa (IDA & IBRD countries)SudanSurinameSwazilandSwedenSwitzerlandTajikistanTanzaniaThailandTimor-LesteTogoTongaTrinidad and TobagoTunisiaTurkeyTurkmenistanTuvaluUgandaUkraineUnited Arab EmiratesUnited KingdomUnited StatesUpper middle incomeUruguayUzbekistanVanuatuVenezuela, RBVietnamWest Bank and GazaWorldYemen, Rep.ZambiaZimbabwe línea de tiempo (timeline):
En esta escala de tiempo se presenta un gráfico de 1991 y 2016 de Sweden. Los datos de 1990 están ausentes. El número de observaciones reales por fecha: 26.
Fuente (nombre):
Indicadores del desarrollo mundial
Fuente (organización):
World Bank, International Comparison Program database.
Categorías:
Economy & Growth
Se ha actualizado:
23 abr 2017 año
Los indicadores de los cambios de valor en los últimos años
Mínimo:
238.004 bn
1 ene 1994 año
Máximo:
456.188 bn
1 ene 2016 año
A la fecha de observación
Valor
Cambio absoluto
El cambio con respecto al valor anterior
1 ene 1991 año
258.541 bn
+258.541 bn
0.0%
1 ene 1992 año
252.911 bn
-5.629 bn
-2.18%
1 ene 1993 año
245.116 bn
-7.795 bn
-3.08%
1 ene 1994 año
238.004 bn
-7.112 bn
-2.9%
1 ene 1995 año
253.781 bn
+15.777 bn
6.63%
1 ene 1996 año
264.375 bn
+10.594 bn
4.17%
1 ene 1997 año
268.942 bn
+4.567 bn
1.73%
1 ene 1998 año
276.983 bn
+8.042 bn
2.99%
1 ene 1999 año
291.965 bn
+14.981 bn
5.41%
1 ene 2000 año
311.55 bn
+19.585 bn
6.71%
1 ene 2001 año
327.071 bn
+15.521 bn
4.98%
1 ene 2002 año
332.25 bn
+5.179 bn
1.58%
1 ene 2003 año
339.772 bn
+7.522 bn
2.26%
1 ene 2004 año
352.995 bn
+13.223 bn
3.89%
1 ene 2005 año
364.107 bn
+11.112 bn
3.15%
1 ene 2006 año
377.331 bn
+13.224 bn
3.63%
1 ene 2007 año
398.968 bn
+21.637 bn
5.73%
1 ene 2008 año
417.386 bn
+18.418 bn
4.62%
1 ene 2009 año
417.067 bn
-319.048 millones
-0.08%
1 ene 2010 año
389.802 bn
-27.264 bn
-6.54%
1 ene 2011 año
414.581 bn
+24.779 bn
6.36%
1 ene 2012 año
425.808 bn
+11.227 bn
2.71%
1 ene 2013 año
425.682 bn
-125.961 millones
-0.03%
1 ene 2014 año
428.649 bn
+2.966 bn
0.7%
1 ene 2015 año
437.853 bn
+9.204 bn
2.15%
1 ene 2016 año
456.188 bn
+18.335 bn
4.19%
Ranking de los países por los datos estadísticos actuales


Comentarios: