29
/es/
es
AIzaSyAYiBZKx7MnpbEhh9jyipgxe19OcubqV5w
April 1, 2024
123525
Ecuador
ECU
true
2
1
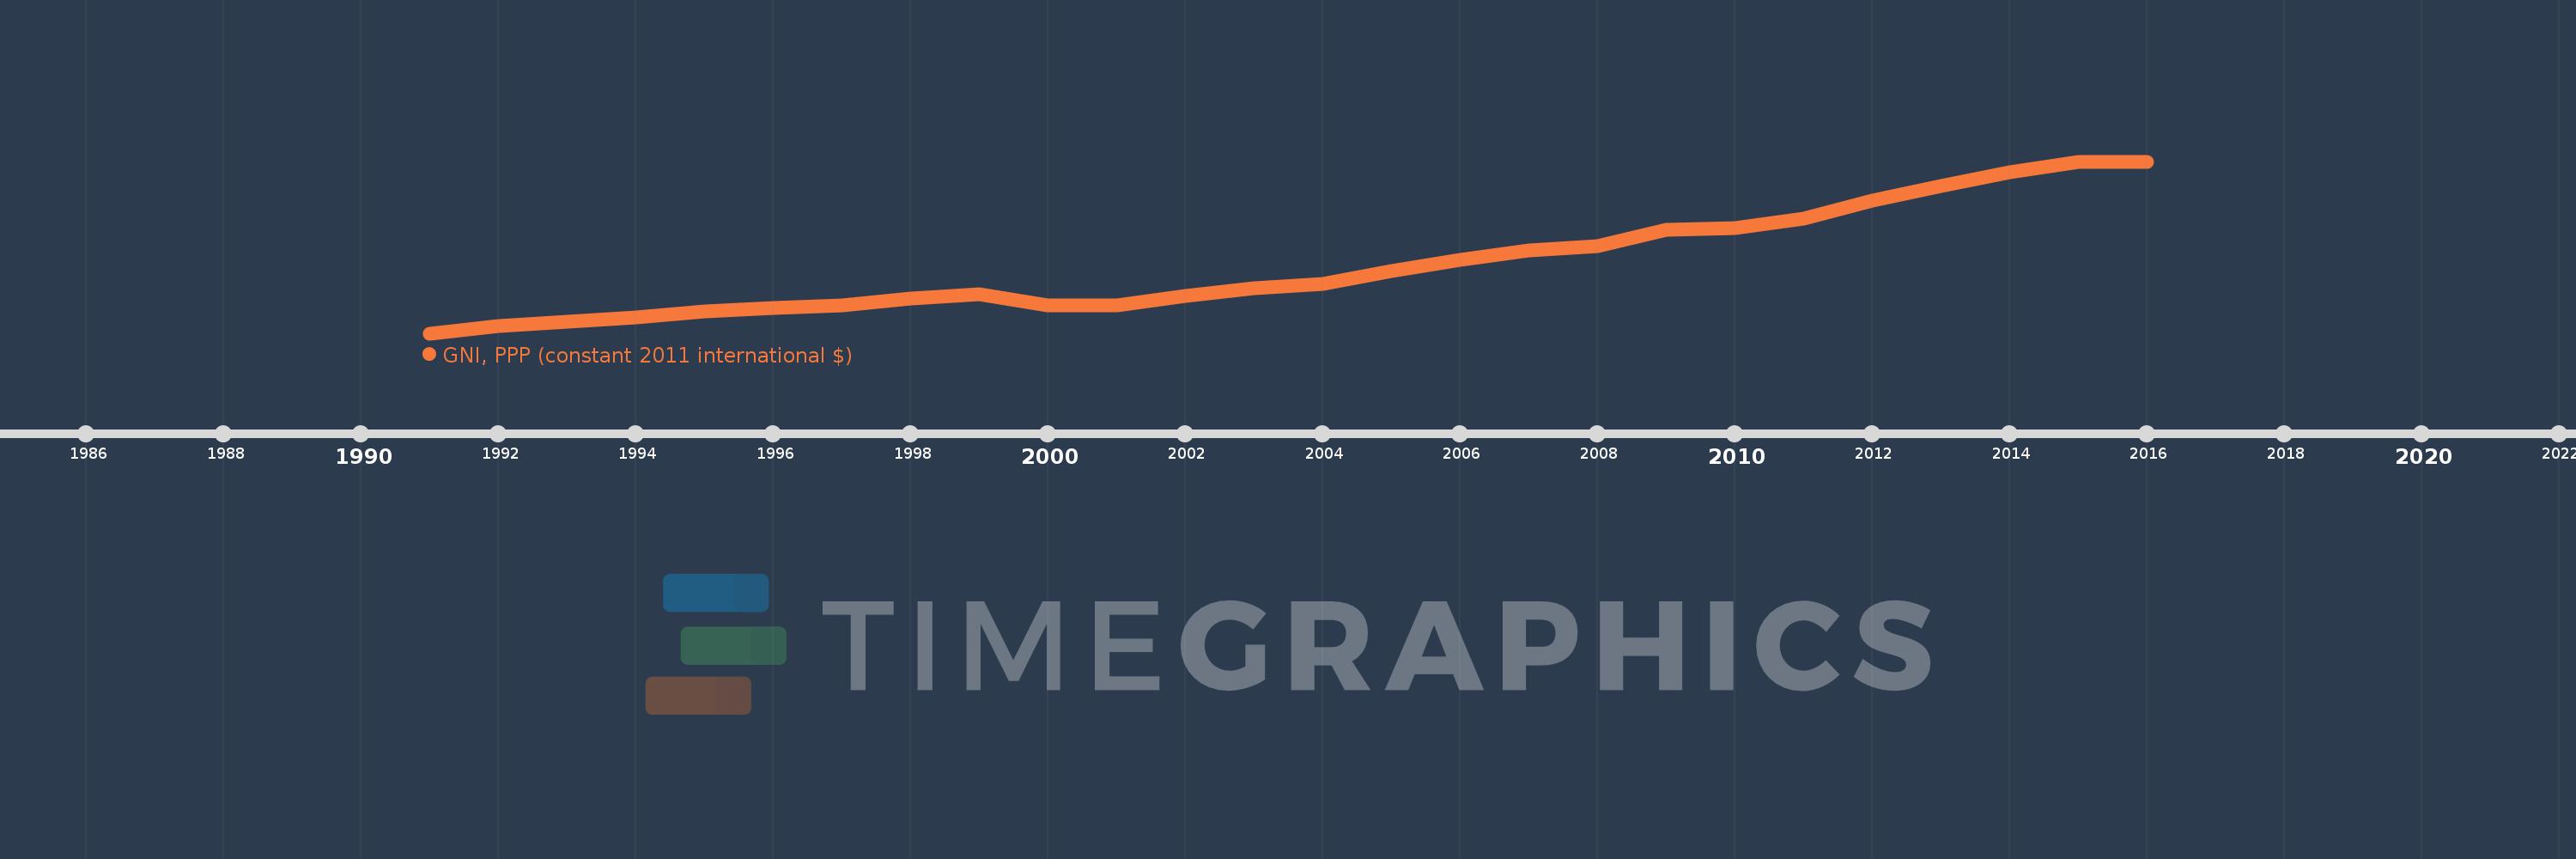
GNI, PPP (constant 2011 international $)
2016,2015,2014,2013,2012,2011,2010,2009,2008,2007,2006,2005,2004,2003,2002,2001,2000,1999,1998,1997,1996,1995,1994,1993,1992,1991
Estas estadísticas en otros países:
AfghanistanAlbaniaAlgeriaAngolaAntigua and BarbudaArab WorldArgentinaArmeniaAustraliaAustriaAzerbaijanBahamas, TheBahrainBangladeshBarbadosBelarusBelgiumBelizeBeninBermudaBhutanBoliviaBosnia and HerzegovinaBotswanaBrazilBrunei DarussalamBulgariaBurkina FasoBurundiCabo VerdeCambodiaCameroonCanadaCaribbean small statesCentral African RepublicCentral Europe and the BalticsChadChileChinaColombiaComorosCongo, Dem. Rep.Congo, Rep.Costa RicaCote d'IvoireCroatiaCubaCyprusCzech RepublicDenmarkDominicaDominican RepublicEarly-demographic dividendEast Asia & PacificEast Asia & Pacific (excluding high income)East Asia & Pacific (IDA & IBRD countries)EcuadorEgypt, Arab Rep.El SalvadorEquatorial GuineaEritreaEstoniaEthiopiaEuro areaEurope & Central AsiaEurope & Central Asia (excluding high income)Europe & Central Asia (IDA & IBRD countries)European UnionFijiFinlandFranceGabonGambia, TheGeorgiaGermanyGhanaGreeceGrenadaGuatemalaGuineaGuinea-BissauGuyanaHaitiHeavily indebted poor countries (HIPC)High incomeHondurasHong Kong SAR, ChinaHungaryIBRD onlyIcelandIDA & IBRD totalIDA blendIDA onlyIDA totalIndiaIndonesiaIran, Islamic Rep.IraqIrelandIsraelItalyJamaicaJapanJordanKazakhstanKenyaKiribatiKorea, Rep.KosovoKuwaitKyrgyz RepublicLao PDRLate-demographic dividendLatin America & Caribbean Latin America & Caribbean (excluding high income)Latin America & the Caribbean (IDA & IBRD countries)LatviaLeast developed countries: UN classificationLebanonLesothoLiberiaLibyaLithuaniaLow & middle incomeLow incomeLower middle incomeLuxembourgMacao SAR, ChinaMacedonia, FYRMadagascarMalawiMalaysiaMaldivesMaliMaltaMarshall IslandsMauritaniaMauritiusMexicoMicronesia, Fed. Sts.Middle East & North AfricaMiddle East & North Africa (excluding high income)Middle East & North Africa (IDA & IBRD countries)Middle incomeMoldovaMongoliaMontenegroMoroccoMozambiqueMyanmarNamibiaNauruNepalNetherlandsNew ZealandNicaraguaNigerNigeriaNorth AmericaNorwayOECD membersOmanOther small statesPakistanPalauPanamaPapua New GuineaParaguayPeruPhilippinesPolandPortugalPost-demographic dividendPre-demographic dividendPuerto RicoQatarRomaniaRussian FederationRwandaSamoaSao Tome and PrincipeSaudi ArabiaSenegalSerbiaSeychellesSierra LeoneSingaporeSlovak RepublicSloveniaSmall statesSolomon IslandsSouth AfricaSouth AsiaSouth Asia (IDA & IBRD)South SudanSpainSri LankaSt. Kitts and NevisSt. LuciaSt. Vincent and the GrenadinesSub-Saharan Africa Sub-Saharan Africa (excluding high income)Sub-Saharan Africa (IDA & IBRD countries)SudanSurinameSwazilandSwedenSwitzerlandTajikistanTanzaniaThailandTimor-LesteTogoTongaTrinidad and TobagoTunisiaTurkeyTurkmenistanTuvaluUgandaUkraineUnited Arab EmiratesUnited KingdomUnited StatesUpper middle incomeUruguayUzbekistanVanuatuVenezuela, RBVietnamWest Bank and GazaWorldYemen, Rep.ZambiaZimbabwe línea de tiempo (timeline):
En esta escala de tiempo se presenta un gráfico de 1991 y 2016 de Ecuador. Los datos de 1990 están ausentes. El número de observaciones reales por fecha: 26.
Fuente (nombre):
Indicadores del desarrollo mundial
Fuente (organización):
World Bank, International Comparison Program database.
Categorías:
Economy & Growth
Se ha actualizado:
23 abr 2017 año
Los indicadores de los cambios de valor en los últimos años
Mínimo:
70.373 bn
1 ene 1991 año
Máximo:
171.051 bn
1 ene 2015 año
A la fecha de observación
Valor
Cambio absoluto
El cambio con respecto al valor anterior
1 ene 1991 año
70.373 bn
+70.373 bn
0.0%
1 ene 1992 año
74.462 bn
+4.089 bn
5.81%
1 ene 1993 año
77.086 bn
+2.624 bn
3.52%
1 ene 1994 año
79.461 bn
+2.375 bn
3.08%
1 ene 1995 año
83.163 bn
+3.703 bn
4.66%
1 ene 1996 año
85.338 bn
+2.175 bn
2.62%
1 ene 1997 año
86.549 bn
+1.21 bn
1.42%
1 ene 1998 año
90.641 bn
+4.092 bn
4.73%
1 ene 1999 año
93.205 bn
+2.564 bn
2.83%
1 ene 2000 año
86.708 bn
-6.496 bn
-6.97%
1 ene 2001 año
86.56 bn
-148.593 millones
-0.17%
1 ene 2002 año
92.232 bn
+5.672 bn
6.55%
1 ene 2003 año
96.899 bn
+4.666 bn
5.06%
1 ene 2004 año
99.276 bn
+2.377 bn
2.45%
1 ene 2005 año
107.046 bn
+7.769 bn
7.83%
1 ene 2006 año
113.336 bn
+6.291 bn
5.88%
1 ene 2007 año
118.761 bn
+5.425 bn
4.79%
1 ene 2008 año
121.303 bn
+2.542 bn
2.14%
1 ene 2009 año
131.01 bn
+9.707 bn
8.0%
1 ene 2010 año
132.239 bn
+1.229 bn
0.94%
1 ene 2011 año
137.619 bn
+5.38 bn
4.07%
1 ene 2012 año
148.272 bn
+10.653 bn
7.74%
1 ene 2013 año
156.819 bn
+8.547 bn
5.76%
1 ene 2014 año
164.629 bn
+7.81 bn
4.98%
1 ene 2015 año
171.051 bn
+6.422 bn
3.9%
1 ene 2016 año
171.047 bn
-4.143 millones
0.0%
Ranking de los países por los datos estadísticos actuales


Comentarios: