29
/es/
es
AIzaSyAYiBZKx7MnpbEhh9jyipgxe19OcubqV5w
April 1, 2024
167523
Kenya
KEN
true
2
1
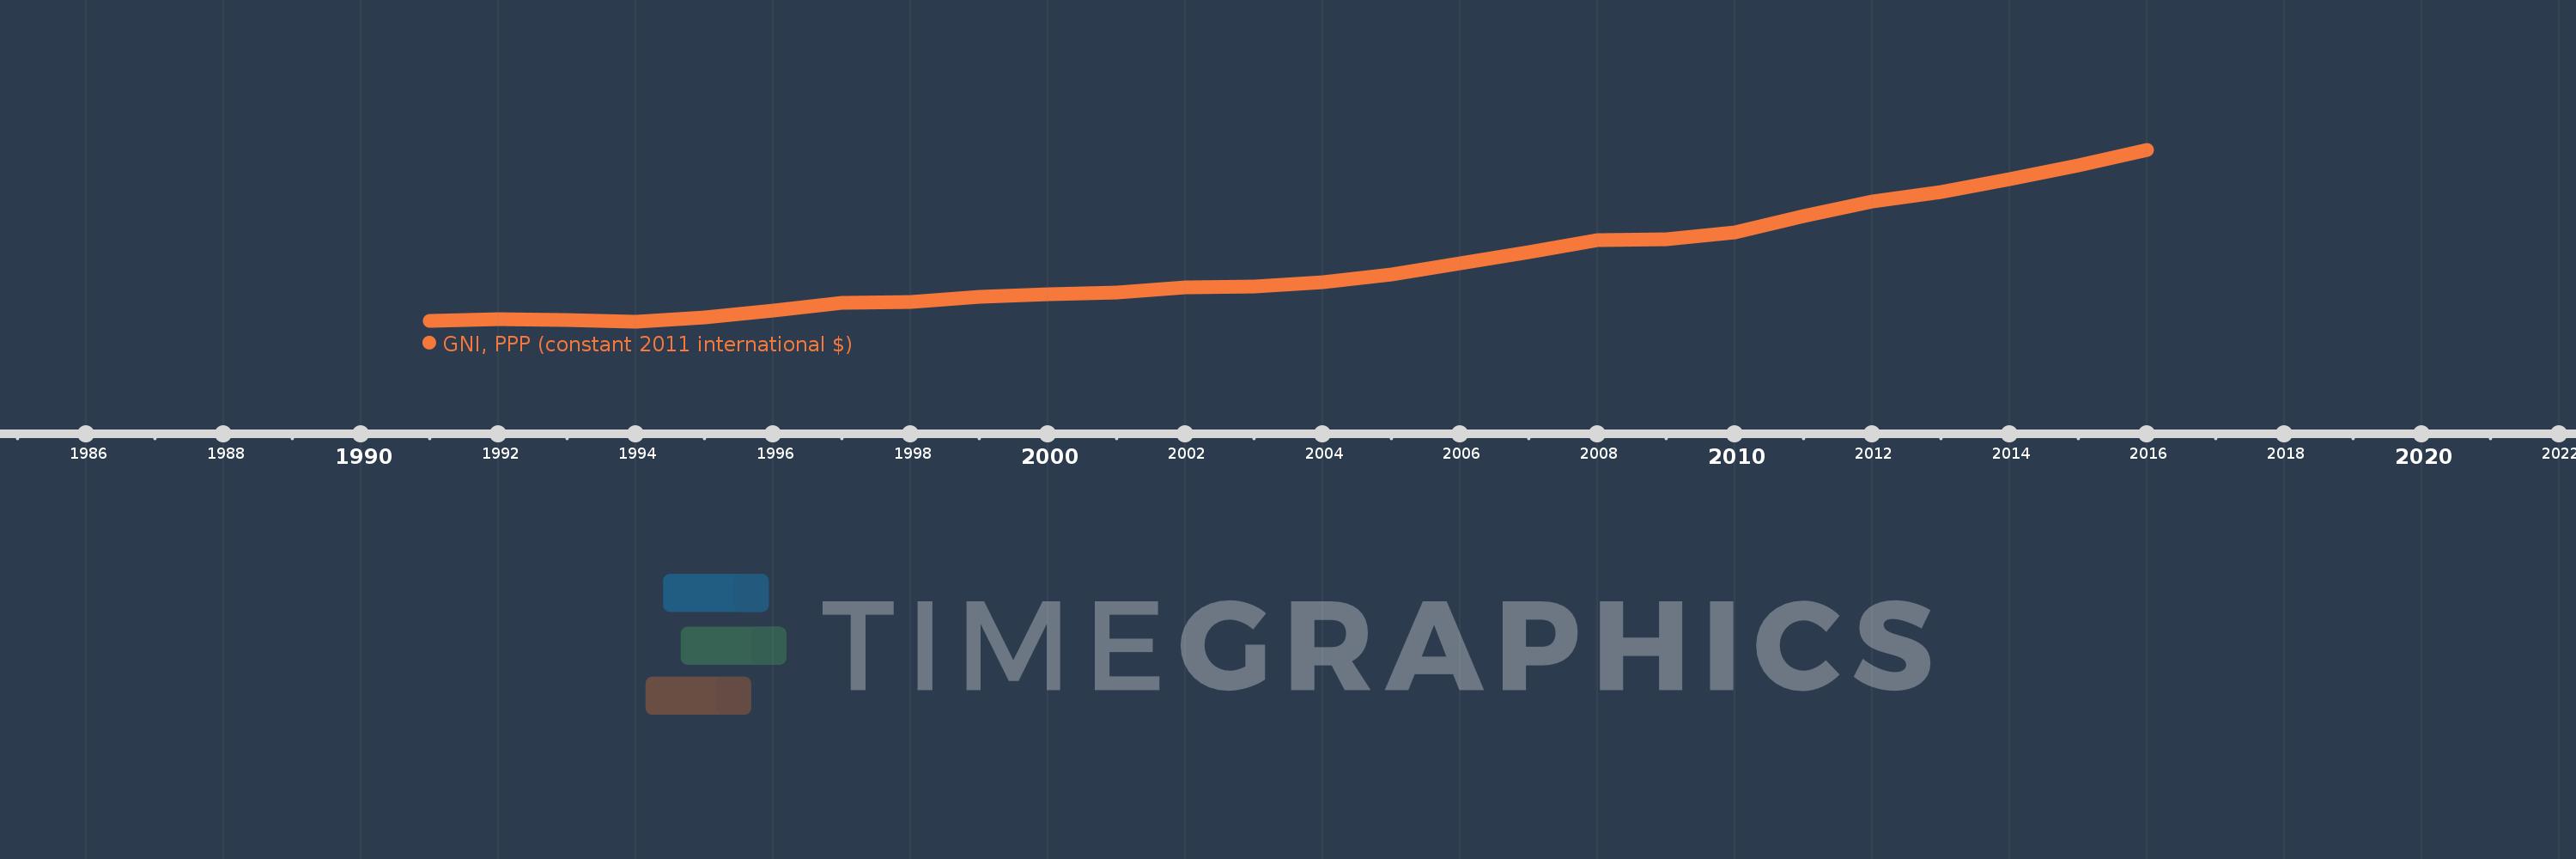
GNI, PPP (constant 2011 international $)
2016,2015,2014,2013,2012,2011,2010,2009,2008,2007,2006,2005,2004,2003,2002,2001,2000,1999,1998,1997,1996,1995,1994,1993,1992,1991
Estas estadísticas en otros países:
AfghanistanAlbaniaAlgeriaAngolaAntigua and BarbudaArab WorldArgentinaArmeniaAustraliaAustriaAzerbaijanBahamas, TheBahrainBangladeshBarbadosBelarusBelgiumBelizeBeninBermudaBhutanBoliviaBosnia and HerzegovinaBotswanaBrazilBrunei DarussalamBulgariaBurkina FasoBurundiCabo VerdeCambodiaCameroonCanadaCaribbean small statesCentral African RepublicCentral Europe and the BalticsChadChileChinaColombiaComorosCongo, Dem. Rep.Congo, Rep.Costa RicaCote d'IvoireCroatiaCubaCyprusCzech RepublicDenmarkDominicaDominican RepublicEarly-demographic dividendEast Asia & PacificEast Asia & Pacific (excluding high income)East Asia & Pacific (IDA & IBRD countries)EcuadorEgypt, Arab Rep.El SalvadorEquatorial GuineaEritreaEstoniaEthiopiaEuro areaEurope & Central AsiaEurope & Central Asia (excluding high income)Europe & Central Asia (IDA & IBRD countries)European UnionFijiFinlandFranceGabonGambia, TheGeorgiaGermanyGhanaGreeceGrenadaGuatemalaGuineaGuinea-BissauGuyanaHaitiHeavily indebted poor countries (HIPC)High incomeHondurasHong Kong SAR, ChinaHungaryIBRD onlyIcelandIDA & IBRD totalIDA blendIDA onlyIDA totalIndiaIndonesiaIran, Islamic Rep.IraqIrelandIsraelItalyJamaicaJapanJordanKazakhstanKenyaKiribatiKorea, Rep.KosovoKuwaitKyrgyz RepublicLao PDRLate-demographic dividendLatin America & Caribbean Latin America & Caribbean (excluding high income)Latin America & the Caribbean (IDA & IBRD countries)LatviaLeast developed countries: UN classificationLebanonLesothoLiberiaLibyaLithuaniaLow & middle incomeLow incomeLower middle incomeLuxembourgMacao SAR, ChinaMacedonia, FYRMadagascarMalawiMalaysiaMaldivesMaliMaltaMarshall IslandsMauritaniaMauritiusMexicoMicronesia, Fed. Sts.Middle East & North AfricaMiddle East & North Africa (excluding high income)Middle East & North Africa (IDA & IBRD countries)Middle incomeMoldovaMongoliaMontenegroMoroccoMozambiqueMyanmarNamibiaNauruNepalNetherlandsNew ZealandNicaraguaNigerNigeriaNorth AmericaNorwayOECD membersOmanOther small statesPakistanPalauPanamaPapua New GuineaParaguayPeruPhilippinesPolandPortugalPost-demographic dividendPre-demographic dividendPuerto RicoQatarRomaniaRussian FederationRwandaSamoaSao Tome and PrincipeSaudi ArabiaSenegalSerbiaSeychellesSierra LeoneSingaporeSlovak RepublicSloveniaSmall statesSolomon IslandsSouth AfricaSouth AsiaSouth Asia (IDA & IBRD)South SudanSpainSri LankaSt. Kitts and NevisSt. LuciaSt. Vincent and the GrenadinesSub-Saharan Africa Sub-Saharan Africa (excluding high income)Sub-Saharan Africa (IDA & IBRD countries)SudanSurinameSwazilandSwedenSwitzerlandTajikistanTanzaniaThailandTimor-LesteTogoTongaTrinidad and TobagoTunisiaTurkeyTurkmenistanTuvaluUgandaUkraineUnited Arab EmiratesUnited KingdomUnited StatesUpper middle incomeUruguayUzbekistanVanuatuVenezuela, RBVietnamWest Bank and GazaWorldYemen, Rep.ZambiaZimbabwe línea de tiempo (timeline):
En esta escala de tiempo se presenta un gráfico de 1991 y 2016 de Kenya. Los datos de 1990 están ausentes. El número de observaciones reales por fecha: 26.
Fuente (nombre):
Indicadores del desarrollo mundial
Fuente (organización):
World Bank, International Comparison Program database.
Categorías:
Economy & Growth
Se ha actualizado:
23 abr 2017 año
Los indicadores de los cambios de valor en los últimos años
Mínimo:
52.898 bn
1 ene 1994 año
Máximo:
132.659 bn
1 ene 2016 año
A la fecha de observación
Valor
Cambio absoluto
El cambio con respecto al valor anterior
1 ene 1991 año
53.616 bn
+53.616 bn
0.0%
1 ene 1992 año
54.142 bn
+526.345 millones
0.98%
1 ene 1993 año
53.825 bn
-317.466 millones
-0.59%
1 ene 1994 año
52.898 bn
-926.037 millones
-1.72%
1 ene 1995 año
54.922 bn
+2.023 bn
3.82%
1 ene 1996 año
58.314 bn
+3.392 bn
6.18%
1 ene 1997 año
61.704 bn
+3.39 bn
5.81%
1 ene 1998 año
62.302 bn
+598.455 millones
0.97%
1 ene 1999 año
64.581 bn
+2.279 bn
3.66%
1 ene 2000 año
65.803 bn
+1.222 bn
1.89%
1 ene 2001 año
66.422 bn
+619.134 millones
0.94%
1 ene 2002 año
68.837 bn
+2.415 bn
3.64%
1 ene 2003 año
69.351 bn
+513.345 millones
0.75%
1 ene 2004 año
71.268 bn
+1.918 bn
2.77%
1 ene 2005 año
75.075 bn
+3.807 bn
5.34%
1 ene 2006 año
80.145 bn
+5.07 bn
6.75%
1 ene 2007 año
85.136 bn
+4.991 bn
6.23%
1 ene 2008 año
90.815 bn
+5.679 bn
6.67%
1 ene 2009 año
91.342 bn
+526.252 millones
0.58%
1 ene 2010 año
94.328 bn
+2.987 bn
3.27%
1 ene 2011 año
102.007 bn
+7.679 bn
8.14%
1 ene 2012 año
108.651 bn
+6.644 bn
6.51%
1 ene 2013 año
113.257 bn
+4.605 bn
4.24%
1 ene 2014 año
119.393 bn
+6.136 bn
5.42%
1 ene 2015 año
125.639 bn
+6.245 bn
5.23%
1 ene 2016 año
132.659 bn
+7.02 bn
5.59%
Ranking de los países por los datos estadísticos actuales


Comentarios: