29
/es/
es
AIzaSyAYiBZKx7MnpbEhh9jyipgxe19OcubqV5w
April 1, 2024
164870
Jordan
JOR
true
2
1
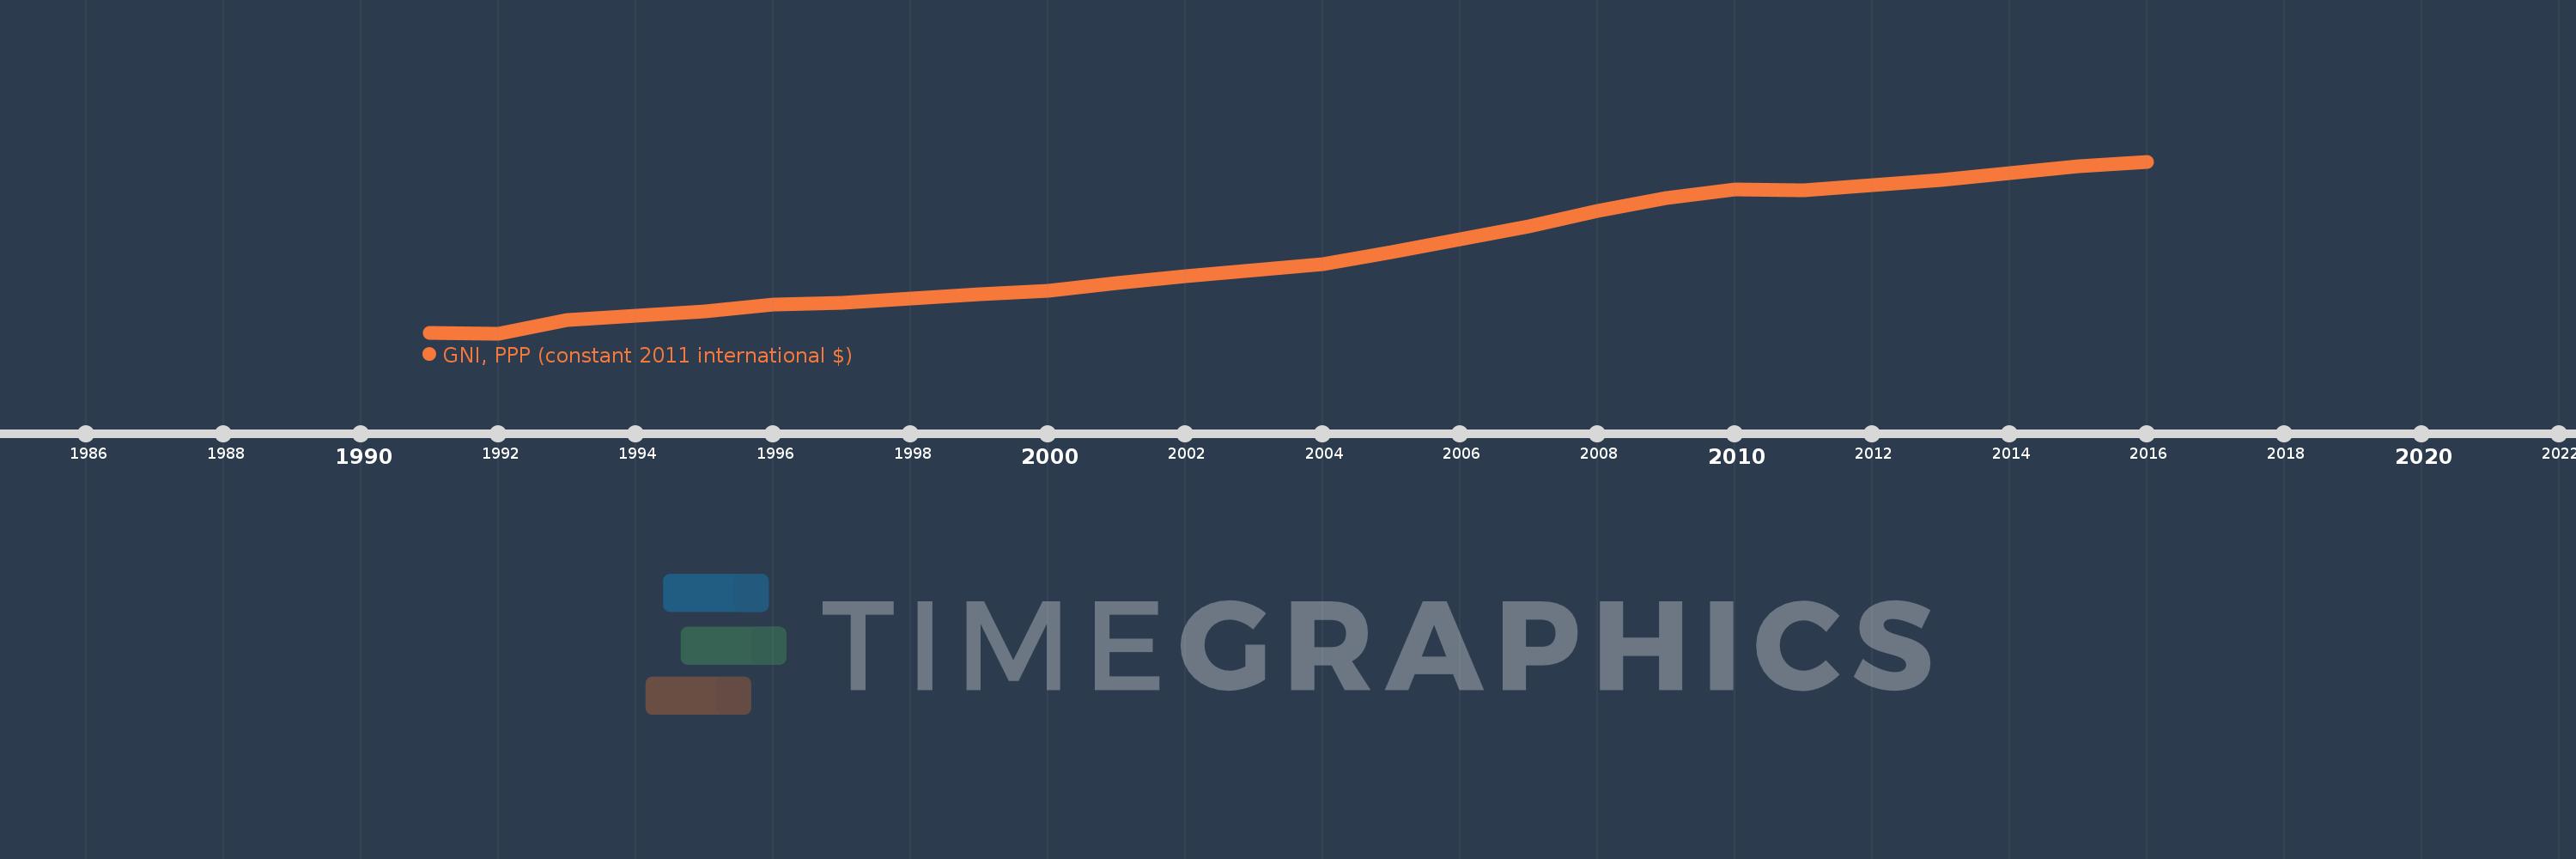
GNI, PPP (constant 2011 international $)
2016,2015,2014,2013,2012,2011,2010,2009,2008,2007,2006,2005,2004,2003,2002,2001,2000,1999,1998,1997,1996,1995,1994,1993,1992,1991
Estas estadísticas en otros países:
AfghanistanAlbaniaAlgeriaAngolaAntigua and BarbudaArab WorldArgentinaArmeniaAustraliaAustriaAzerbaijanBahamas, TheBahrainBangladeshBarbadosBelarusBelgiumBelizeBeninBermudaBhutanBoliviaBosnia and HerzegovinaBotswanaBrazilBrunei DarussalamBulgariaBurkina FasoBurundiCabo VerdeCambodiaCameroonCanadaCaribbean small statesCentral African RepublicCentral Europe and the BalticsChadChileChinaColombiaComorosCongo, Dem. Rep.Congo, Rep.Costa RicaCote d'IvoireCroatiaCubaCyprusCzech RepublicDenmarkDominicaDominican RepublicEarly-demographic dividendEast Asia & PacificEast Asia & Pacific (excluding high income)East Asia & Pacific (IDA & IBRD countries)EcuadorEgypt, Arab Rep.El SalvadorEquatorial GuineaEritreaEstoniaEthiopiaEuro areaEurope & Central AsiaEurope & Central Asia (excluding high income)Europe & Central Asia (IDA & IBRD countries)European UnionFijiFinlandFranceGabonGambia, TheGeorgiaGermanyGhanaGreeceGrenadaGuatemalaGuineaGuinea-BissauGuyanaHaitiHeavily indebted poor countries (HIPC)High incomeHondurasHong Kong SAR, ChinaHungaryIBRD onlyIcelandIDA & IBRD totalIDA blendIDA onlyIDA totalIndiaIndonesiaIran, Islamic Rep.IraqIrelandIsraelItalyJamaicaJapanJordanKazakhstanKenyaKiribatiKorea, Rep.KosovoKuwaitKyrgyz RepublicLao PDRLate-demographic dividendLatin America & Caribbean Latin America & Caribbean (excluding high income)Latin America & the Caribbean (IDA & IBRD countries)LatviaLeast developed countries: UN classificationLebanonLesothoLiberiaLibyaLithuaniaLow & middle incomeLow incomeLower middle incomeLuxembourgMacao SAR, ChinaMacedonia, FYRMadagascarMalawiMalaysiaMaldivesMaliMaltaMarshall IslandsMauritaniaMauritiusMexicoMicronesia, Fed. Sts.Middle East & North AfricaMiddle East & North Africa (excluding high income)Middle East & North Africa (IDA & IBRD countries)Middle incomeMoldovaMongoliaMontenegroMoroccoMozambiqueMyanmarNamibiaNauruNepalNetherlandsNew ZealandNicaraguaNigerNigeriaNorth AmericaNorwayOECD membersOmanOther small statesPakistanPalauPanamaPapua New GuineaParaguayPeruPhilippinesPolandPortugalPost-demographic dividendPre-demographic dividendPuerto RicoQatarRomaniaRussian FederationRwandaSamoaSao Tome and PrincipeSaudi ArabiaSenegalSerbiaSeychellesSierra LeoneSingaporeSlovak RepublicSloveniaSmall statesSolomon IslandsSouth AfricaSouth AsiaSouth Asia (IDA & IBRD)South SudanSpainSri LankaSt. Kitts and NevisSt. LuciaSt. Vincent and the GrenadinesSub-Saharan Africa Sub-Saharan Africa (excluding high income)Sub-Saharan Africa (IDA & IBRD countries)SudanSurinameSwazilandSwedenSwitzerlandTajikistanTanzaniaThailandTimor-LesteTogoTongaTrinidad and TobagoTunisiaTurkeyTurkmenistanTuvaluUgandaUkraineUnited Arab EmiratesUnited KingdomUnited StatesUpper middle incomeUruguayUzbekistanVanuatuVenezuela, RBVietnamWest Bank and GazaWorldYemen, Rep.ZambiaZimbabwe línea de tiempo (timeline):
En esta escala de tiempo se presenta un gráfico de 1991 y 2016 de Jordan. Los datos de 1990 están ausentes. El número de observaciones reales por fecha: 26.
Fuente (nombre):
Indicadores del desarrollo mundial
Fuente (organización):
World Bank, International Comparison Program database.
Categorías:
Economy & Growth
Se ha actualizado:
23 abr 2017 año
Los indicadores de los cambios de valor en los últimos años
Mínimo:
20.933 bn
1 ene 1992 año
Máximo:
76.751 bn
1 ene 2016 año
A la fecha de observación
Valor
Cambio absoluto
El cambio con respecto al valor anterior
1 ene 1991 año
21.088 bn
+21.088 bn
0.0%
1 ene 1992 año
20.933 bn
-154.747 millones
-0.73%
1 ene 1993 año
25.306 bn
+4.373 bn
20.89%
1 ene 1994 año
26.745 bn
+1.439 bn
5.69%
1 ene 1995 año
28.162 bn
+1.416 bn
5.3%
1 ene 1996 año
30.214 bn
+2.052 bn
7.29%
1 ene 1997 año
30.813 bn
+599.069 millones
1.98%
1 ene 1998 año
32.281 bn
+1.468 bn
4.76%
1 ene 1999 año
33.62 bn
+1.339 bn
4.15%
1 ene 2000 año
34.71 bn
+1.09 bn
3.24%
1 ene 2001 año
37.288 bn
+2.578 bn
7.43%
1 ene 2002 año
39.479 bn
+2.191 bn
5.88%
1 ene 2003 año
41.372 bn
+1.892 bn
4.79%
1 ene 2004 año
43.266 bn
+1.894 bn
4.58%
1 ene 2005 año
47.41 bn
+4.144 bn
9.58%
1 ene 2006 año
51.381 bn
+3.971 bn
8.38%
1 ene 2007 año
55.715 bn
+4.335 bn
8.44%
1 ene 2008 año
60.753 bn
+5.038 bn
9.04%
1 ene 2009 año
64.874 bn
+4.121 bn
6.78%
1 ene 2010 año
67.811 bn
+2.937 bn
4.53%
1 ene 2011 año
67.485 bn
-326.268 millones
-0.48%
1 ene 2012 año
69.157 bn
+1.672 bn
2.48%
1 ene 2013 año
70.77 bn
+1.613 bn
2.33%
1 ene 2014 año
72.936 bn
+2.166 bn
3.06%
1 ene 2015 año
75.098 bn
+2.162 bn
2.96%
1 ene 2016 año
76.751 bn
+1.653 bn
2.2%
Ranking de los países por los datos estadísticos actuales


Comentarios: