29
/es/
es
AIzaSyAYiBZKx7MnpbEhh9jyipgxe19OcubqV5w
April 1, 2024
201601
Morocco
MAR
true
2
1
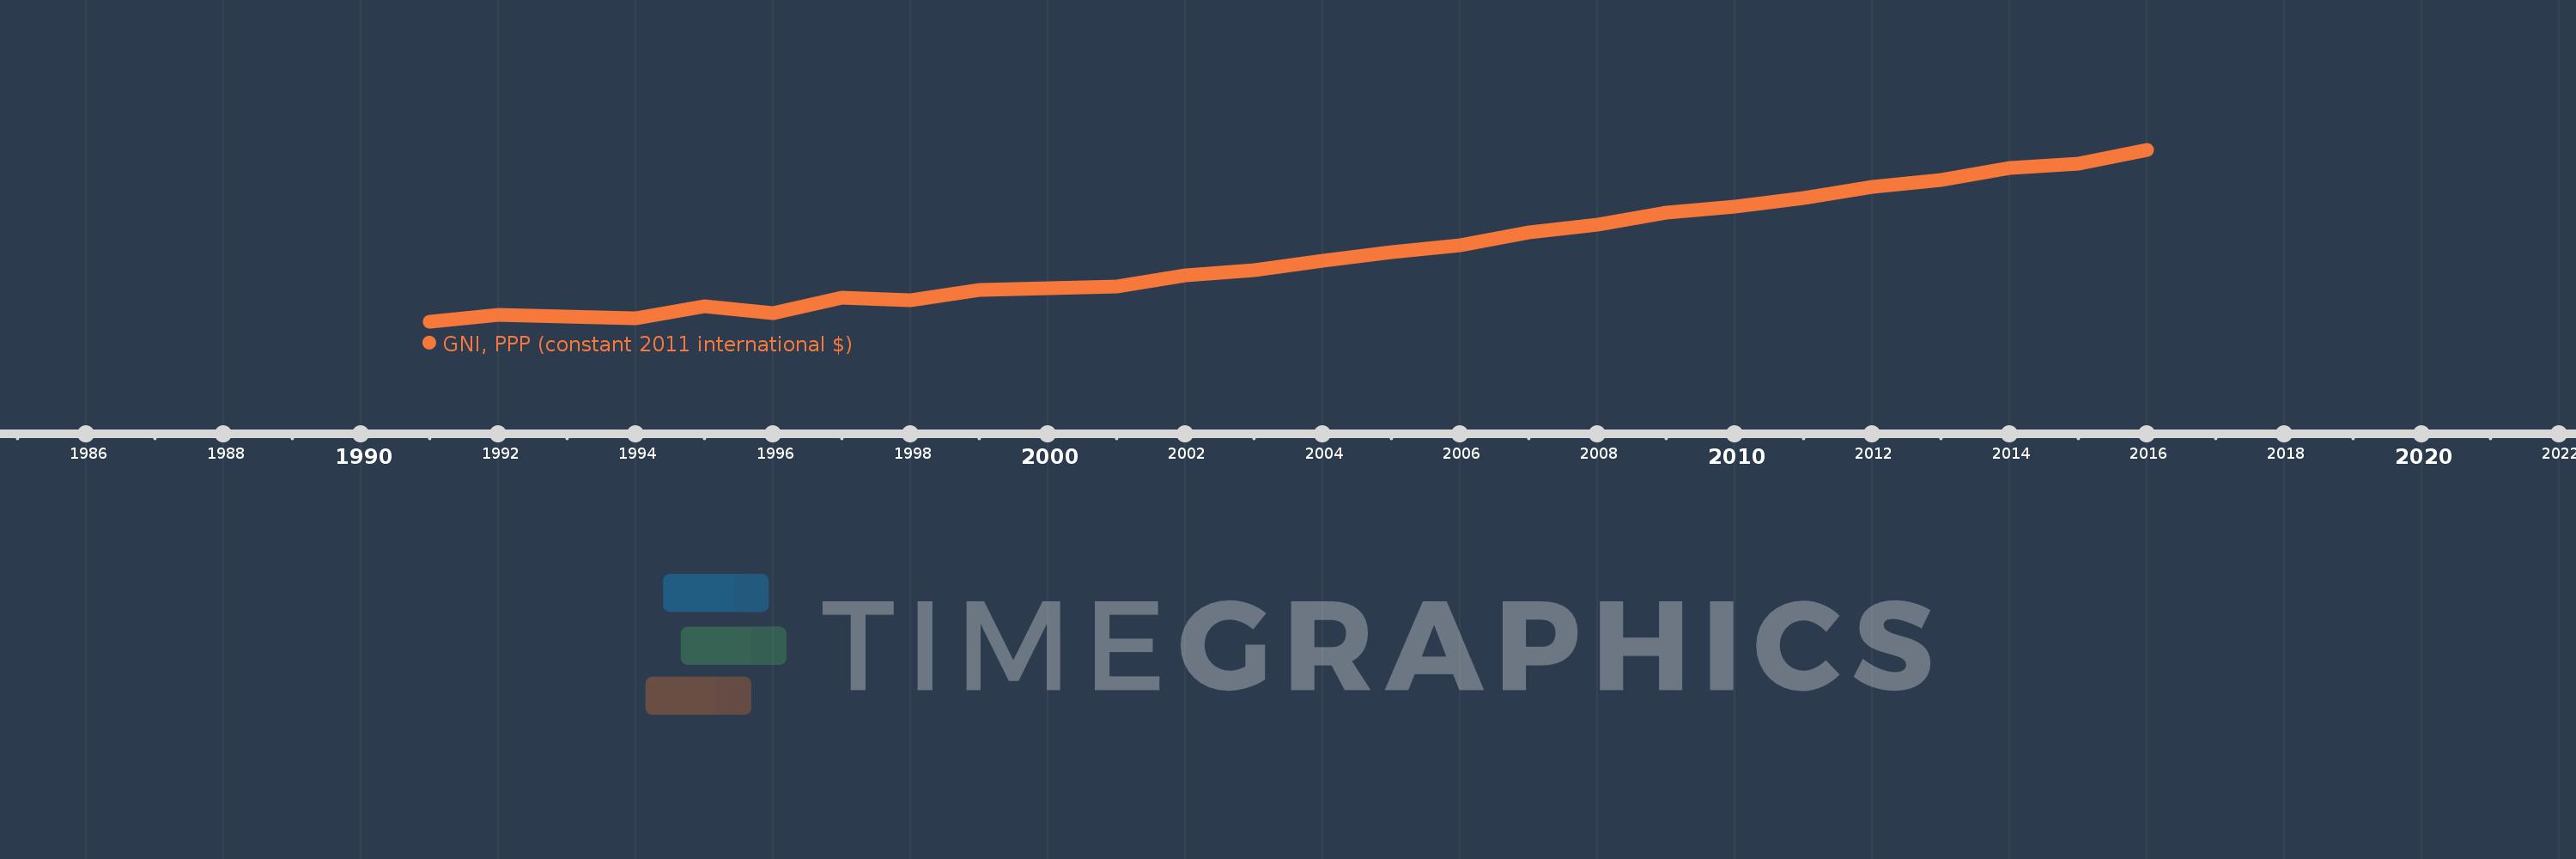
GNI, PPP (constant 2011 international $)
2016,2015,2014,2013,2012,2011,2010,2009,2008,2007,2006,2005,2004,2003,2002,2001,2000,1999,1998,1997,1996,1995,1994,1993,1992,1991
Estas estadísticas en otros países:
AfghanistanAlbaniaAlgeriaAngolaAntigua and BarbudaArab WorldArgentinaArmeniaAustraliaAustriaAzerbaijanBahamas, TheBahrainBangladeshBarbadosBelarusBelgiumBelizeBeninBermudaBhutanBoliviaBosnia and HerzegovinaBotswanaBrazilBrunei DarussalamBulgariaBurkina FasoBurundiCabo VerdeCambodiaCameroonCanadaCaribbean small statesCentral African RepublicCentral Europe and the BalticsChadChileChinaColombiaComorosCongo, Dem. Rep.Congo, Rep.Costa RicaCote d'IvoireCroatiaCubaCyprusCzech RepublicDenmarkDominicaDominican RepublicEarly-demographic dividendEast Asia & PacificEast Asia & Pacific (excluding high income)East Asia & Pacific (IDA & IBRD countries)EcuadorEgypt, Arab Rep.El SalvadorEquatorial GuineaEritreaEstoniaEthiopiaEuro areaEurope & Central AsiaEurope & Central Asia (excluding high income)Europe & Central Asia (IDA & IBRD countries)European UnionFijiFinlandFranceGabonGambia, TheGeorgiaGermanyGhanaGreeceGrenadaGuatemalaGuineaGuinea-BissauGuyanaHaitiHeavily indebted poor countries (HIPC)High incomeHondurasHong Kong SAR, ChinaHungaryIBRD onlyIcelandIDA & IBRD totalIDA blendIDA onlyIDA totalIndiaIndonesiaIran, Islamic Rep.IraqIrelandIsraelItalyJamaicaJapanJordanKazakhstanKenyaKiribatiKorea, Rep.KosovoKuwaitKyrgyz RepublicLao PDRLate-demographic dividendLatin America & Caribbean Latin America & Caribbean (excluding high income)Latin America & the Caribbean (IDA & IBRD countries)LatviaLeast developed countries: UN classificationLebanonLesothoLiberiaLibyaLithuaniaLow & middle incomeLow incomeLower middle incomeLuxembourgMacao SAR, ChinaMacedonia, FYRMadagascarMalawiMalaysiaMaldivesMaliMaltaMarshall IslandsMauritaniaMauritiusMexicoMicronesia, Fed. Sts.Middle East & North AfricaMiddle East & North Africa (excluding high income)Middle East & North Africa (IDA & IBRD countries)Middle incomeMoldovaMongoliaMontenegroMoroccoMozambiqueMyanmarNamibiaNauruNepalNetherlandsNew ZealandNicaraguaNigerNigeriaNorth AmericaNorwayOECD membersOmanOther small statesPakistanPalauPanamaPapua New GuineaParaguayPeruPhilippinesPolandPortugalPost-demographic dividendPre-demographic dividendPuerto RicoQatarRomaniaRussian FederationRwandaSamoaSao Tome and PrincipeSaudi ArabiaSenegalSerbiaSeychellesSierra LeoneSingaporeSlovak RepublicSloveniaSmall statesSolomon IslandsSouth AfricaSouth AsiaSouth Asia (IDA & IBRD)South SudanSpainSri LankaSt. Kitts and NevisSt. LuciaSt. Vincent and the GrenadinesSub-Saharan Africa Sub-Saharan Africa (excluding high income)Sub-Saharan Africa (IDA & IBRD countries)SudanSurinameSwazilandSwedenSwitzerlandTajikistanTanzaniaThailandTimor-LesteTogoTongaTrinidad and TobagoTunisiaTurkeyTurkmenistanTuvaluUgandaUkraineUnited Arab EmiratesUnited KingdomUnited StatesUpper middle incomeUruguayUzbekistanVanuatuVenezuela, RBVietnamWest Bank and GazaWorldYemen, Rep.ZambiaZimbabwe línea de tiempo (timeline):
En esta escala de tiempo se presenta un gráfico de 1991 y 2016 de Morocco. Los datos de 1990 están ausentes. El número de observaciones reales por fecha: 26.
Fuente (nombre):
Indicadores del desarrollo mundial
Fuente (organización):
World Bank, International Comparison Program database.
Categorías:
Economy & Growth
Se ha actualizado:
23 abr 2017 año
Los indicadores de los cambios de valor en los últimos años
Mínimo:
95.364 bn
1 ene 1991 año
Máximo:
252.556 bn
1 ene 2016 año
A la fecha de observación
Valor
Cambio absoluto
El cambio con respecto al valor anterior
1 ene 1991 año
95.364 bn
+95.364 bn
0.0%
1 ene 1992 año
101.992 bn
+6.629 bn
6.95%
1 ene 1993 año
100.164 bn
-1.829 bn
-1.79%
1 ene 1994 año
98.882 bn
-1.281 bn
-1.28%
1 ene 1995 año
109.952 bn
+11.069 bn
11.19%
1 ene 1996 año
103.519 bn
-6.433 bn
-5.85%
1 ene 1997 año
117.253 bn
+13.734 bn
13.27%
1 ene 1998 año
115.309 bn
-1.944 bn
-1.66%
1 ene 1999 año
124.422 bn
+9.113 bn
7.9%
1 ene 2000 año
125.876 bn
+1.454 bn
1.17%
1 ene 2001 año
128.137 bn
+2.261 bn
1.8%
1 ene 2002 año
137.694 bn
+9.557 bn
7.46%
1 ene 2003 año
142.435 bn
+4.741 bn
3.44%
1 ene 2004 año
151.232 bn
+8.797 bn
6.18%
1 ene 2005 año
159.11 bn
+7.877 bn
5.21%
1 ene 2006 año
165.233 bn
+6.124 bn
3.85%
1 ene 2007 año
177.556 bn
+12.323 bn
7.46%
1 ene 2008 año
184.181 bn
+6.626 bn
3.73%
1 ene 2009 año
195.371 bn
+11.19 bn
6.08%
1 ene 2010 año
201.237 bn
+5.866 bn
3.0%
1 ene 2011 año
208.947 bn
+7.71 bn
3.83%
1 ene 2012 año
219.272 bn
+10.325 bn
4.94%
1 ene 2013 año
225.155 bn
+5.882 bn
2.68%
1 ene 2014 año
236.333 bn
+11.178 bn
4.96%
1 ene 2015 año
240.545 bn
+4.212 bn
1.78%
1 ene 2016 año
252.556 bn
+12.011 bn
4.99%
Ranking de los países por los datos estadísticos actuales


Comentarios: