29
/es/
es
AIzaSyAYiBZKx7MnpbEhh9jyipgxe19OcubqV5w
April 1, 2024
192957
Mauritania
MRT
true
2
1
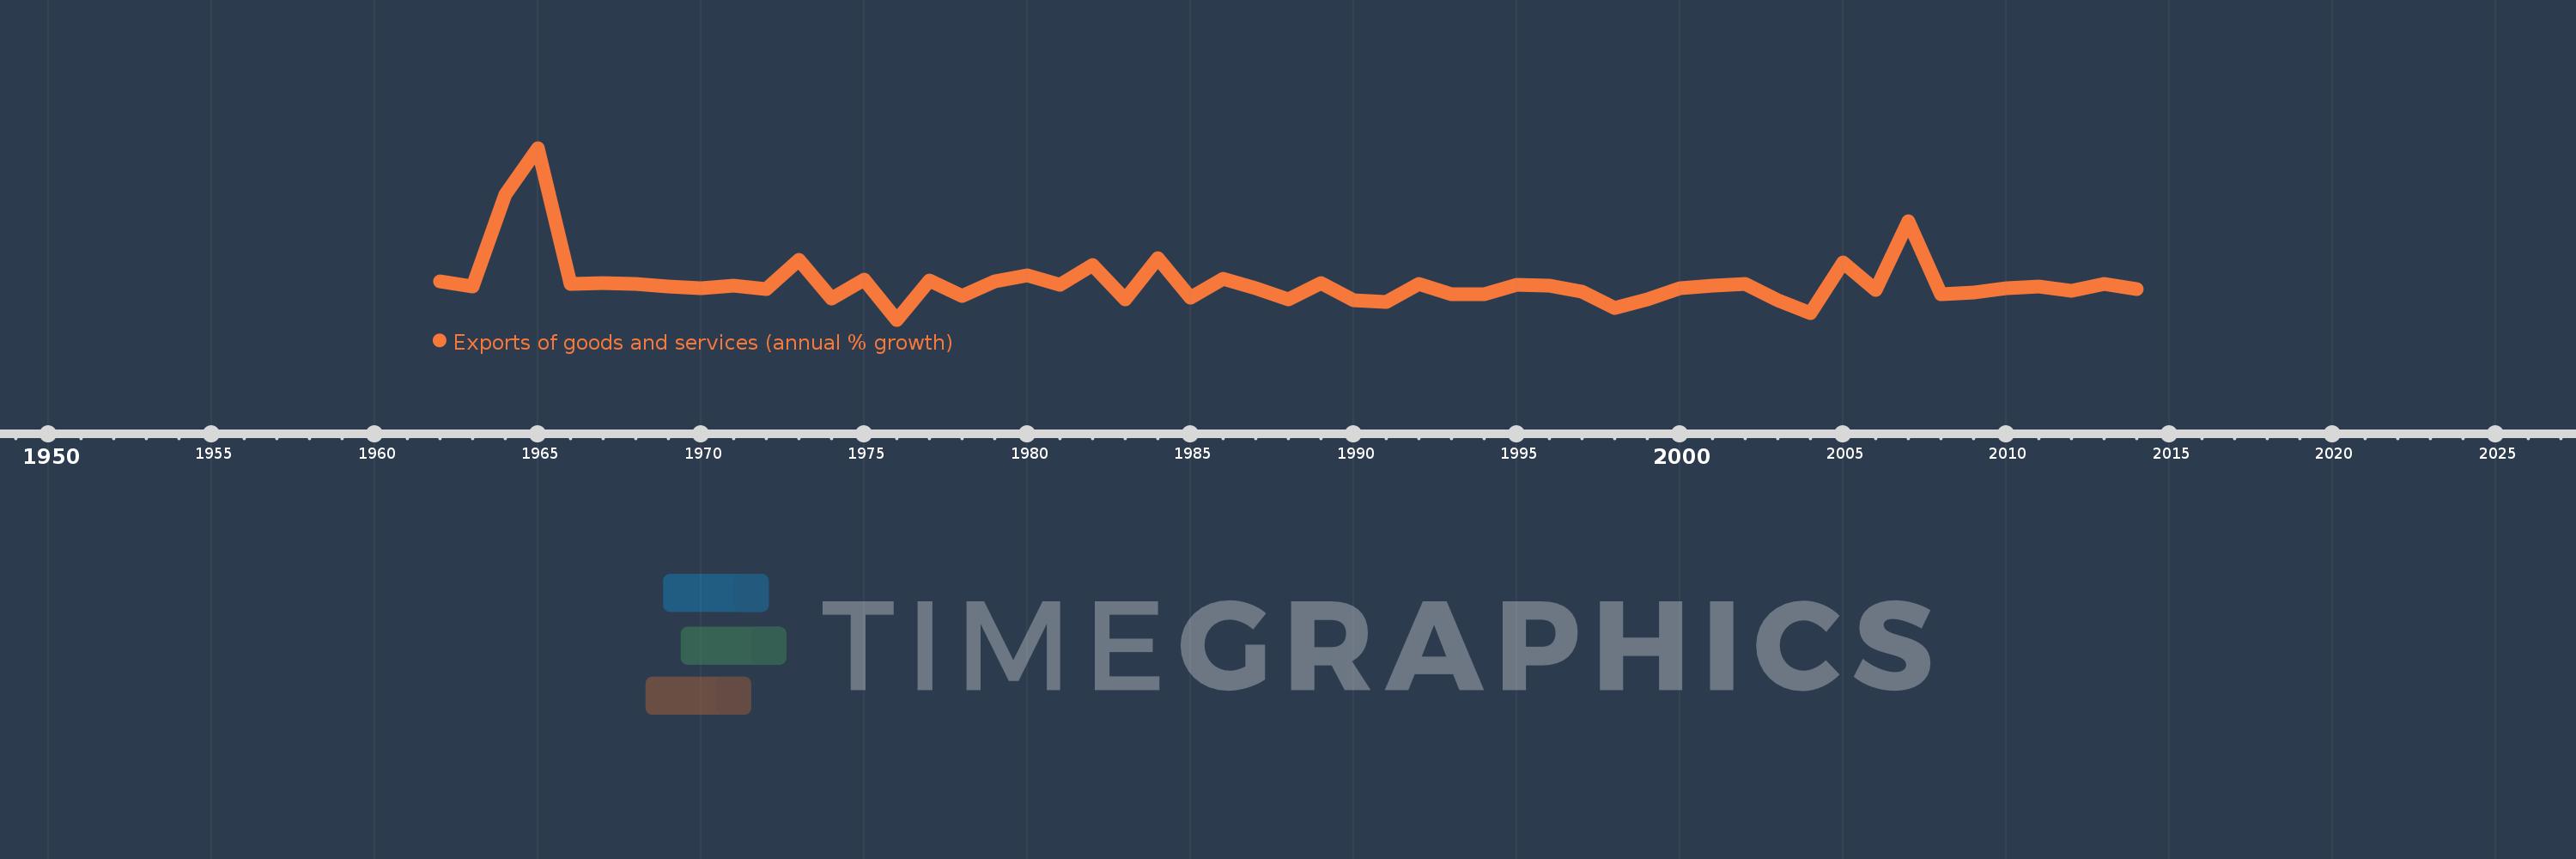
Exports of goods and services (annual % growth)
2014,2013,2012,2011,2010,2009,2008,2007,2006,2005,2004,2003,2002,2001,2000,1999,1998,1997,1996,1995,1994,1993,1992,1991,1990,1989,1988,1987,1986,1985,1984,1983,1982,1981,1980,1979,1978,1977,1976,1975,1974,1973,1972,1971,1970,1969,1968,1967,1966,1965,1964,1963,1962
Estas estadísticas en otros países:
AlbaniaAlgeriaAngolaAntigua and BarbudaArab WorldArgentinaArmeniaAustraliaAustriaAzerbaijanBahamas, TheBahrainBangladeshBarbadosBelarusBelgiumBelizeBeninBhutanBoliviaBosnia and HerzegovinaBotswanaBrazilBrunei DarussalamBulgariaBurkina FasoBurundiCabo VerdeCambodiaCameroonCanadaCaribbean small statesCentral Europe and the BalticsChadChileColombiaComorosCongo, Dem. Rep.Congo, Rep.Costa RicaCote d'IvoireCroatiaCubaCyprusCzech RepublicDenmarkDjiboutiDominican RepublicEarly-demographic dividendEast Asia & PacificEcuadorEgypt, Arab Rep.El SalvadorEquatorial GuineaEritreaEstoniaEthiopiaEuro areaEurope & Central AsiaEurope & Central Asia (excluding high income)Europe & Central Asia (IDA & IBRD countries)European UnionFijiFinlandFranceGabonGambia, TheGeorgiaGermanyGhanaGreeceGuatemalaGuineaGuinea-BissauHaitiHeavily indebted poor countries (HIPC)High incomeHondurasHong Kong SAR, ChinaHungaryIBRD onlyIcelandIDA & IBRD totalIDA blendIDA onlyIDA totalIndiaIndonesiaIran, Islamic Rep.IrelandIsraelItalyJamaicaJapanJordanKazakhstanKenyaKorea, Rep.KosovoKuwaitKyrgyz RepublicLao PDRLatin America & Caribbean Latin America & Caribbean (excluding high income)Latin America & the Caribbean (IDA & IBRD countries)LatviaLebanonLiberiaLibyaLithuaniaLow & middle incomeLow incomeLower middle incomeLuxembourgMacao SAR, ChinaMacedonia, FYRMadagascarMalawiMalaysiaMaliMaltaMauritaniaMauritiusMexicoMiddle East & North AfricaMiddle East & North Africa (excluding high income)Middle East & North Africa (IDA & IBRD countries)Middle incomeMoldovaMongoliaMontenegroMoroccoMozambiqueMyanmarNamibiaNepalNetherlandsNew ZealandNicaraguaNigerNigeriaNorth AmericaNorwayOECD membersOmanOther small statesPakistanPanamaPapua New GuineaParaguayPeruPhilippinesPolandPortugalPost-demographic dividendPre-demographic dividendPuerto RicoQatarRomaniaRussian FederationRwandaSamoaSaudi ArabiaSenegalSerbiaSeychellesSierra LeoneSingaporeSlovak RepublicSloveniaSmall statesSomaliaSouth AfricaSouth AsiaSouth Asia (IDA & IBRD)South SudanSpainSri LankaSub-Saharan Africa Sub-Saharan Africa (excluding high income)Sub-Saharan Africa (IDA & IBRD countries)SudanSurinameSwazilandSwedenSwitzerlandSyrian Arab RepublicTajikistanTanzaniaThailandTimor-LesteTogoTrinidad and TobagoTunisiaTurkeyTurkmenistanUgandaUkraineUnited Arab EmiratesUnited KingdomUnited StatesUruguayUzbekistanVanuatuVenezuela, RBVietnamWest Bank and GazaWorldZambiaZimbabwe línea de tiempo (timeline):
En esta escala de tiempo se presenta un gráfico de 1962 y 2014 de Mauritania. Los datos de 1961 están ausentes. El número de observaciones reales por fecha: 53.
Fuente (nombre):
Indicadores del desarrollo mundial
Fuente (organización):
World Bank national accounts data, and OECD National Accounts data files.
Categorías:
Economy & Growth, Trade
Se ha actualizado:
23 abr 2017 año
Los indicadores de los cambios de valor en los últimos años
Mínimo:
-26.999
1 ene 1976 año
Máximo:
130.909
1 ene 1965 año
A la fecha de observación
Valor
Cambio absoluto
El cambio con respecto al valor anterior
1 ene 1962 año
8.462
+8.462
0.0%
1 ene 1963 año
3.546
-4.915
-58.09%
1 ene 1964 año
88.356
+84.81
2.39 mil%
1 ene 1965 año
130.909
+42.553
48.16%
1 ene 1966 año
6.142
-124.767
-95.31%
1 ene 1967 año
6.692
+0.551
8.96%
1 ene 1968 año
6.229
-0.464
-6.93%
1 ene 1969 año
3.427
-2.802
-44.98%
1 ene 1970 año
2.342
-1.085
-31.66%
1 ene 1971 año
4.414
+2.072
88.45%
1 ene 1972 año
1.574
-2.84
-64.34%
1 ene 1973 año
27.66
+26.086
1.66 mil%
1 ene 1974 año
-7.636
-35.296
-127.61%
1 ene 1975 año
9.497
+17.133
-224.37%
1 ene 1976 año
-26.999
-36.496
-384.3%
1 ene 1977 año
8.921
+35.92
-133.04%
1 ene 1978 año
-5.19
-14.111
-158.18%
1 ene 1979 año
8.063
+13.253
-255.35%
1 ene 1980 año
13.849
+5.786
71.76%
1 ene 1981 año
5.354
-8.494
-61.34%
1 ene 1982 año
23.078
+17.724
331.01%
1 ene 1983 año
-8.247
-31.325
-135.74%
1 ene 1984 año
29.741
+37.988
-460.63%
1 ene 1985 año
-6.571
-36.313
-122.09%
1 ene 1986 año
10.306
+16.878
-256.84%
1 ene 1987 año
2.286
-8.02
-77.82%
1 ene 1988 año
-8.583
-10.869
-475.47%
1 ene 1989 año
6.576
+15.158
-176.61%
1 ene 1990 año
-9.107
-15.683
-238.5%
1 ene 1991 año
-10.971
-1.864
20.46%
1 ene 1992 año
6.3
+17.271
-157.42%
1 ene 1993 año
-3.555
-9.855
-156.43%
1 ene 1994 año
-3.897
-0.342
9.61%
1 ene 1995 año
4.926
+8.823
-226.4%
1 ene 1996 año
3.966
-0.959
-19.48%
1 ene 1997 año
-1.041
-5.008
-126.26%
1 ene 1998 año
-16.482
-15.441
1.48 mil%
1 ene 1999 año
-8.07
+8.413
-51.04%
1 ene 2000 año
2.111
+10.181
-126.17%
1 ene 2001 año
4.044
+1.932
91.51%
1 ene 2002 año
5.806
+1.762
43.57%
1 ene 2003 año
-9.419
-15.224
-262.24%
1 ene 2004 año
-20.666
-11.247
119.41%
1 ene 2005 año
25.966
+46.632
-225.65%
1 ene 2006 año
0.004
-25.962
-99.98%
1 ene 2007 año
63.541
+63.537
1.58 millones%
1 ene 2008 año
-3.66
-67.201
-105.76%
1 ene 2009 año
-1.713
+1.947
-53.2%
1 ene 2010 año
2.185
+3.898
-227.58%
1 ene 2011 año
3.242
+1.056
48.34%
1 ene 2012 año
-0.102
-3.344
-103.14%
1 ene 2013 año
5.961
+6.062
-5.96 mil%
1 ene 2014 año
1.2
-4.76
-79.86%
Ranking de los países por los datos estadísticos actuales


Comentarios: