29
/es/
es
AIzaSyAYiBZKx7MnpbEhh9jyipgxe19OcubqV5w
April 1, 2024
141748
Greece
GRC
true
2
1
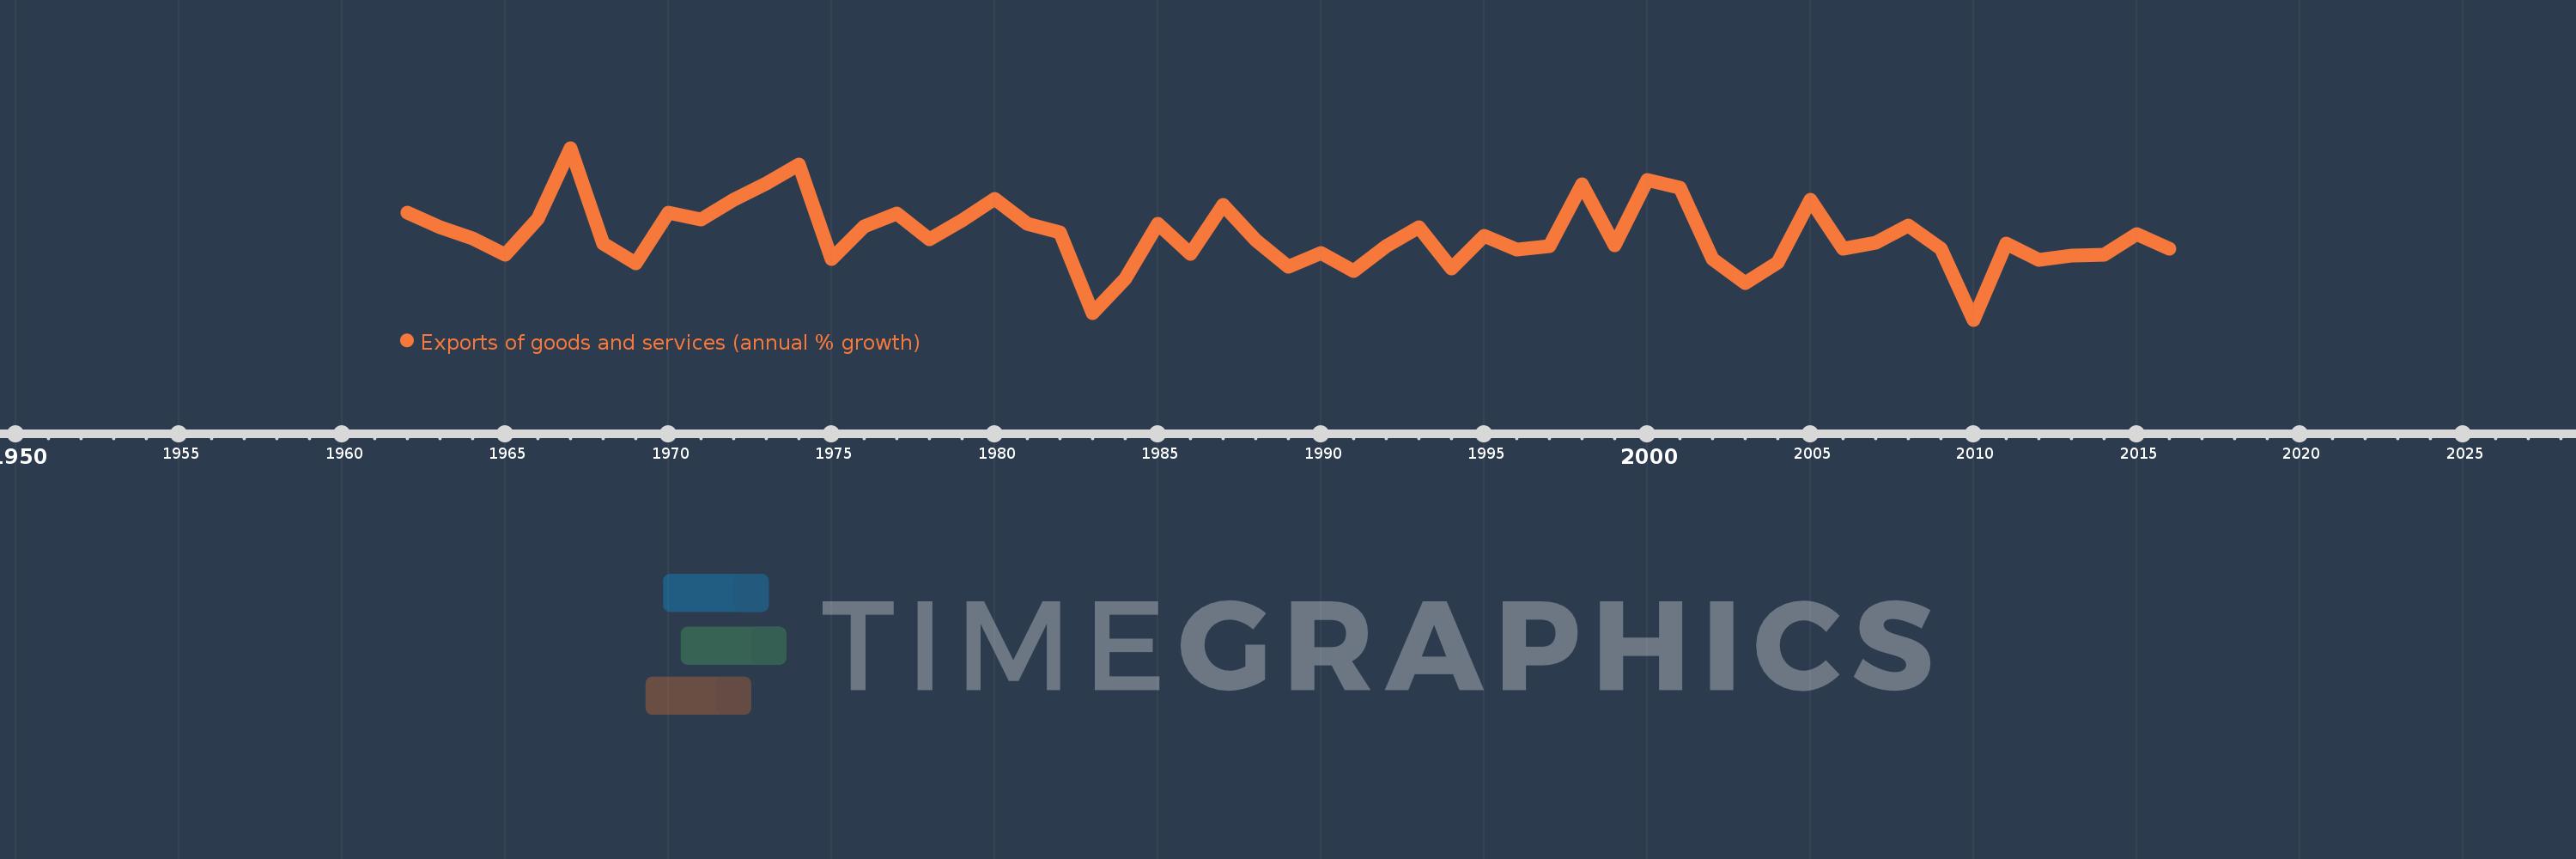
Exports of goods and services (annual % growth)
2016,2015,2014,2013,2012,2011,2010,2009,2008,2007,2006,2005,2004,2003,2002,2001,2000,1999,1998,1997,1996,1995,1994,1993,1992,1991,1990,1989,1988,1987,1986,1985,1984,1983,1982,1981,1980,1979,1978,1977,1976,1975,1974,1973,1972,1971,1970,1969,1968,1967,1966,1965,1964,1963,1962
Estas estadísticas en otros países:
AlbaniaAlgeriaAngolaAntigua and BarbudaArab WorldArgentinaArmeniaAustraliaAustriaAzerbaijanBahamas, TheBahrainBangladeshBarbadosBelarusBelgiumBelizeBeninBhutanBoliviaBosnia and HerzegovinaBotswanaBrazilBrunei DarussalamBulgariaBurkina FasoBurundiCabo VerdeCambodiaCameroonCanadaCaribbean small statesCentral Europe and the BalticsChadChileColombiaComorosCongo, Dem. Rep.Congo, Rep.Costa RicaCote d'IvoireCroatiaCubaCyprusCzech RepublicDenmarkDjiboutiDominican RepublicEarly-demographic dividendEast Asia & PacificEcuadorEgypt, Arab Rep.El SalvadorEquatorial GuineaEritreaEstoniaEthiopiaEuro areaEurope & Central AsiaEurope & Central Asia (excluding high income)Europe & Central Asia (IDA & IBRD countries)European UnionFijiFinlandFranceGabonGambia, TheGeorgiaGermanyGhanaGreeceGuatemalaGuineaGuinea-BissauHaitiHeavily indebted poor countries (HIPC)High incomeHondurasHong Kong SAR, ChinaHungaryIBRD onlyIcelandIDA & IBRD totalIDA blendIDA onlyIDA totalIndiaIndonesiaIran, Islamic Rep.IrelandIsraelItalyJamaicaJapanJordanKazakhstanKenyaKorea, Rep.KosovoKuwaitKyrgyz RepublicLao PDRLatin America & Caribbean Latin America & Caribbean (excluding high income)Latin America & the Caribbean (IDA & IBRD countries)LatviaLebanonLiberiaLibyaLithuaniaLow & middle incomeLow incomeLower middle incomeLuxembourgMacao SAR, ChinaMacedonia, FYRMadagascarMalawiMalaysiaMaliMaltaMauritaniaMauritiusMexicoMiddle East & North AfricaMiddle East & North Africa (excluding high income)Middle East & North Africa (IDA & IBRD countries)Middle incomeMoldovaMongoliaMontenegroMoroccoMozambiqueMyanmarNamibiaNepalNetherlandsNew ZealandNicaraguaNigerNigeriaNorth AmericaNorwayOECD membersOmanOther small statesPakistanPanamaPapua New GuineaParaguayPeruPhilippinesPolandPortugalPost-demographic dividendPre-demographic dividendPuerto RicoQatarRomaniaRussian FederationRwandaSamoaSaudi ArabiaSenegalSerbiaSeychellesSierra LeoneSingaporeSlovak RepublicSloveniaSmall statesSomaliaSouth AfricaSouth AsiaSouth Asia (IDA & IBRD)South SudanSpainSri LankaSub-Saharan Africa Sub-Saharan Africa (excluding high income)Sub-Saharan Africa (IDA & IBRD countries)SudanSurinameSwazilandSwedenSwitzerlandSyrian Arab RepublicTajikistanTanzaniaThailandTimor-LesteTogoTrinidad and TobagoTunisiaTurkeyTurkmenistanUgandaUkraineUnited Arab EmiratesUnited KingdomUnited StatesUruguayUzbekistanVanuatuVenezuela, RBVietnamWest Bank and GazaWorldZambiaZimbabwe línea de tiempo (timeline):
En esta escala de tiempo se presenta un gráfico de 1962 y 2016 de Greece. Los datos de 1961 están ausentes. El número de observaciones reales por fecha: 55.
Fuente (nombre):
Indicadores del desarrollo mundial
Fuente (organización):
World Bank national accounts data, and OECD National Accounts data files.
Categorías:
Economy & Growth, Trade
Se ha actualizado:
23 abr 2017 año
Los indicadores de los cambios de valor en los últimos años
Mínimo:
-18.519
1 ene 2010 año
Máximo:
34.424
1 ene 1967 año
A la fecha de observación
Valor
Cambio absoluto
El cambio con respecto al valor anterior
1 ene 1962 año
14.524
+14.524
0.0%
1 ene 1963 año
9.965
-4.559
-31.39%
1 ene 1964 año
6.657
-3.308
-33.19%
1 ene 1965 año
1.65
-5.008
-75.22%
1 ene 1966 año
12.667
+11.017
667.76%
1 ene 1967 año
34.424
+21.757
171.77%
1 ene 1968 año
5.059
-29.364
-85.3%
1 ene 1969 año
-0.999
-6.058
-119.74%
1 ene 1970 año
14.579
+15.578
-1.56 mil%
1 ene 1971 año
12.362
-2.217
-15.21%
1 ene 1972 año
18.418
+6.055
48.98%
1 ene 1973 año
23.375
+4.958
26.92%
1 ene 1974 año
29.401
+6.026
25.78%
1 ene 1975 año
0.115
-29.286
-99.61%
1 ene 1976 año
10.32
+10.205
8.86 mil%
1 ene 1977 año
14.319
+3.999
38.75%
1 ene 1978 año
6.314
-8.005
-55.91%
1 ene 1979 año
12.049
+5.735
90.84%
1 ene 1980 año
18.805
+6.756
56.07%
1 ene 1981 año
11.071
-7.734
-41.13%
1 ene 1982 año
8.407
-2.664
-24.07%
1 ene 1983 año
-16.464
-24.871
-295.84%
1 ene 1984 año
-5.846
+10.618
-64.49%
1 ene 1985 año
10.945
+16.791
-287.2%
1 ene 1986 año
1.831
-9.114
-83.27%
1 ene 1987 año
16.849
+15.018
820.14%
1 ene 1988 año
5.937
-10.912
-64.76%
1 ene 1989 año
-2.123
-8.06
-135.75%
1 ene 1990 año
1.943
+4.066
-191.53%
1 ene 1991 año
-3.469
-5.412
-278.53%
1 ene 1992 año
4.123
+7.592
-218.87%
1 ene 1993 año
10.021
+5.898
143.04%
1 ene 1994 año
-2.597
-12.618
-125.91%
1 ene 1995 año
7.384
+9.981
-384.35%
1 ene 1996 año
2.999
-4.385
-59.38%
1 ene 1997 año
4.084
+1.085
36.19%
1 ene 1998 año
23.103
+19.018
465.63%
1 ene 1999 año
4.514
-18.588
-80.46%
1 ene 2000 año
24.445
+19.93
441.49%
1 ene 2001 año
22.183
-2.262
-9.25%
1 ene 2002 año
0.12
-22.063
-99.46%
1 ene 2003 año
-7.325
-7.445
-6.19 mil%
1 ene 2004 año
-0.734
+6.59
-89.98%
1 ene 2005 año
18.551
+19.285
-2.63 mil%
1 ene 2006 año
3.339
-15.211
-82.0%
1 ene 2007 año
5.213
+1.873
56.09%
1 ene 2008 año
10.618
+5.406
103.7%
1 ene 2009 año
3.473
-7.146
-67.29%
1 ene 2010 año
-18.519
-21.992
-633.27%
1 ene 2011 año
4.861
+23.381
-126.25%
1 ene 2012 año
0.027
-4.834
-99.44%
1 ene 2013 año
1.173
+1.146
4.22 mil%
1 ene 2014 año
1.511
+0.338
28.78%
1 ene 2015 año
7.751
+6.24
413.0%
1 ene 2016 año
3.359
-4.392
-56.66%
Ranking de los países por los datos estadísticos actuales


Comentarios: