29
/es/
es
AIzaSyAYiBZKx7MnpbEhh9jyipgxe19OcubqV5w
April 1, 2024
127296
Equatorial Guinea
GNQ
true
2
1
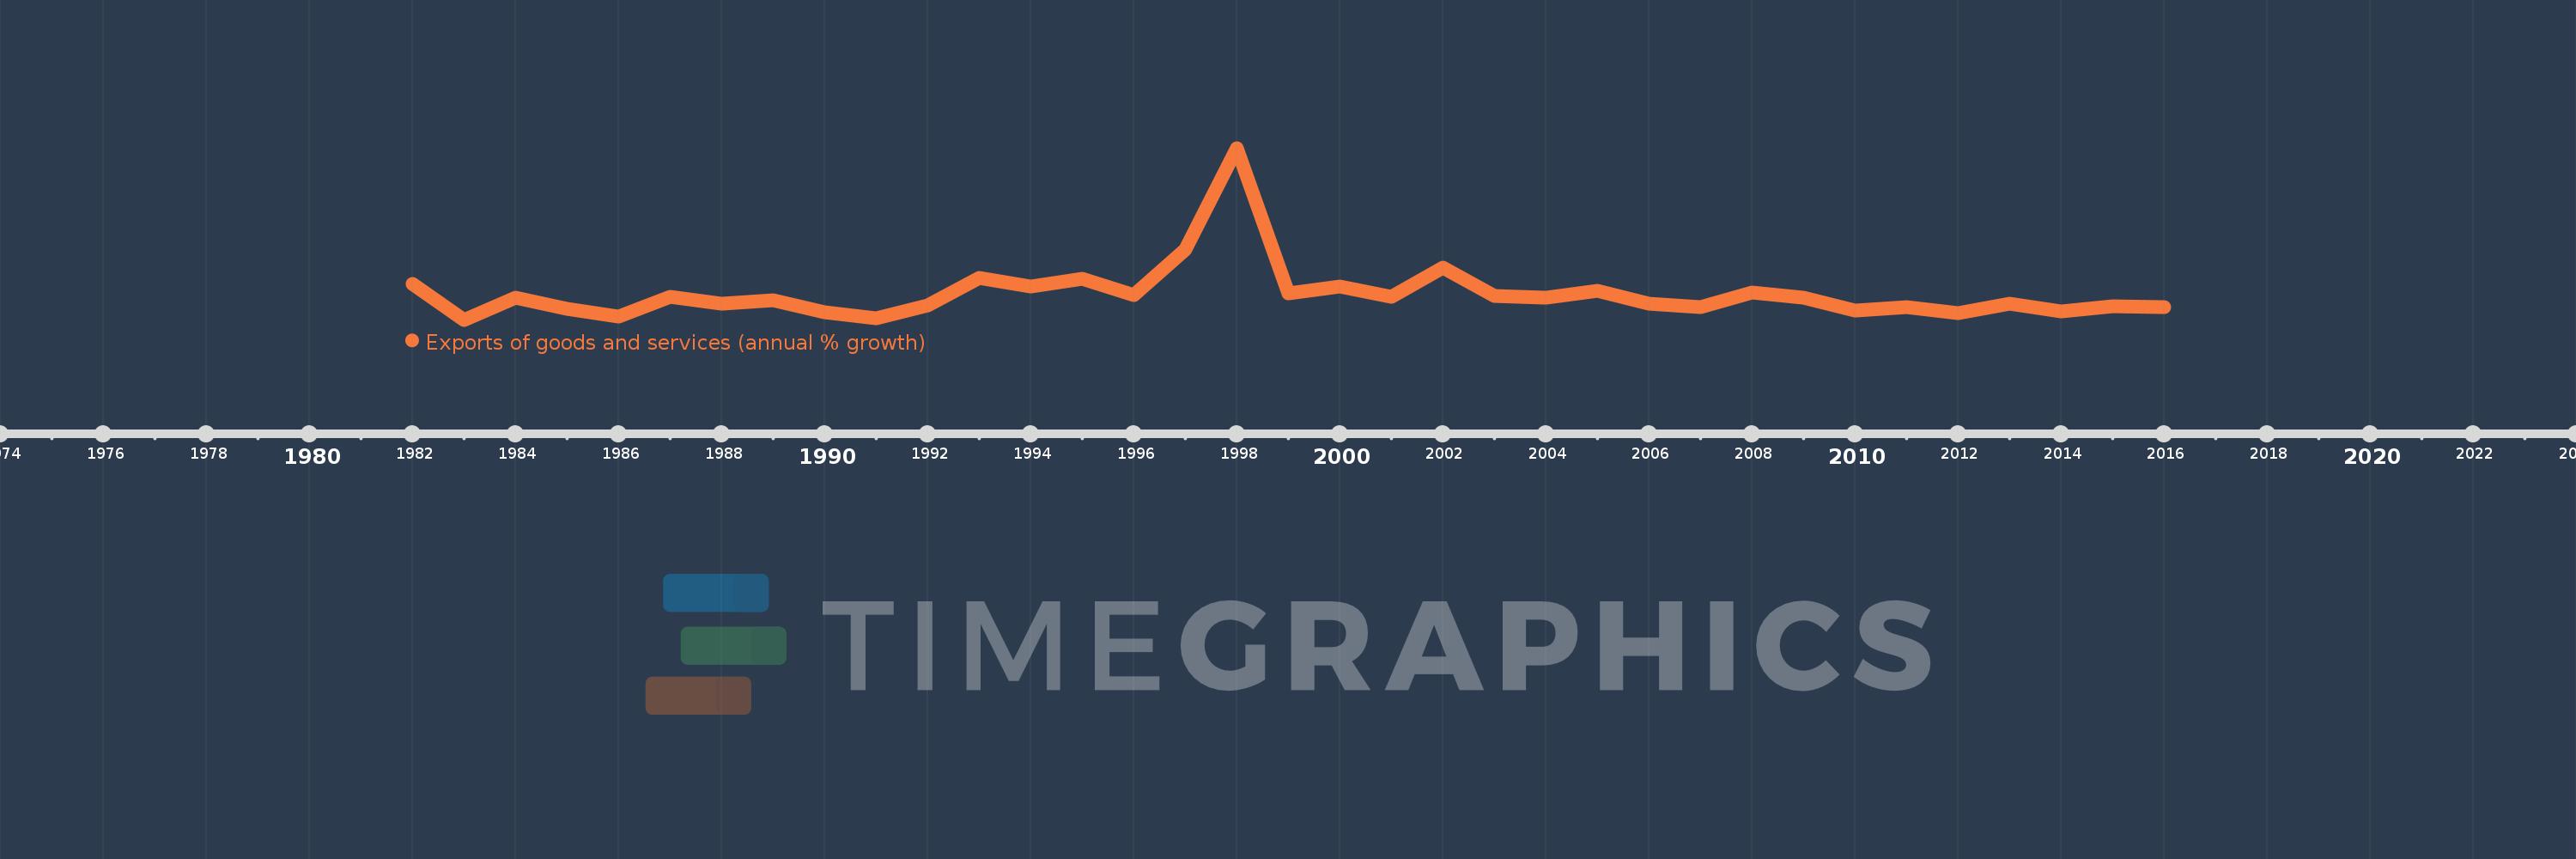
Exports of goods and services (annual % growth)
2016,2015,2014,2013,2012,2011,2010,2009,2008,2007,2006,2005,2004,2003,2002,2001,2000,1999,1998,1997,1996,1995,1994,1993,1992,1991,1990,1989,1988,1987,1986,1985,1984,1983,1982
Estas estadísticas en otros países:
AlbaniaAlgeriaAngolaAntigua and BarbudaArab WorldArgentinaArmeniaAustraliaAustriaAzerbaijanBahamas, TheBahrainBangladeshBarbadosBelarusBelgiumBelizeBeninBhutanBoliviaBosnia and HerzegovinaBotswanaBrazilBrunei DarussalamBulgariaBurkina FasoBurundiCabo VerdeCambodiaCameroonCanadaCaribbean small statesCentral Europe and the BalticsChadChileColombiaComorosCongo, Dem. Rep.Congo, Rep.Costa RicaCote d'IvoireCroatiaCubaCyprusCzech RepublicDenmarkDjiboutiDominican RepublicEarly-demographic dividendEast Asia & PacificEcuadorEgypt, Arab Rep.El SalvadorEquatorial GuineaEritreaEstoniaEthiopiaEuro areaEurope & Central AsiaEurope & Central Asia (excluding high income)Europe & Central Asia (IDA & IBRD countries)European UnionFijiFinlandFranceGabonGambia, TheGeorgiaGermanyGhanaGreeceGuatemalaGuineaGuinea-BissauHaitiHeavily indebted poor countries (HIPC)High incomeHondurasHong Kong SAR, ChinaHungaryIBRD onlyIcelandIDA & IBRD totalIDA blendIDA onlyIDA totalIndiaIndonesiaIran, Islamic Rep.IrelandIsraelItalyJamaicaJapanJordanKazakhstanKenyaKorea, Rep.KosovoKuwaitKyrgyz RepublicLao PDRLatin America & Caribbean Latin America & Caribbean (excluding high income)Latin America & the Caribbean (IDA & IBRD countries)LatviaLebanonLiberiaLibyaLithuaniaLow & middle incomeLow incomeLower middle incomeLuxembourgMacao SAR, ChinaMacedonia, FYRMadagascarMalawiMalaysiaMaliMaltaMauritaniaMauritiusMexicoMiddle East & North AfricaMiddle East & North Africa (excluding high income)Middle East & North Africa (IDA & IBRD countries)Middle incomeMoldovaMongoliaMontenegroMoroccoMozambiqueMyanmarNamibiaNepalNetherlandsNew ZealandNicaraguaNigerNigeriaNorth AmericaNorwayOECD membersOmanOther small statesPakistanPanamaPapua New GuineaParaguayPeruPhilippinesPolandPortugalPost-demographic dividendPre-demographic dividendPuerto RicoQatarRomaniaRussian FederationRwandaSamoaSaudi ArabiaSenegalSerbiaSeychellesSierra LeoneSingaporeSlovak RepublicSloveniaSmall statesSomaliaSouth AfricaSouth AsiaSouth Asia (IDA & IBRD)South SudanSpainSri LankaSub-Saharan Africa Sub-Saharan Africa (excluding high income)Sub-Saharan Africa (IDA & IBRD countries)SudanSurinameSwazilandSwedenSwitzerlandSyrian Arab RepublicTajikistanTanzaniaThailandTimor-LesteTogoTrinidad and TobagoTunisiaTurkeyTurkmenistanUgandaUkraineUnited Arab EmiratesUnited KingdomUnited StatesUruguayUzbekistanVanuatuVenezuela, RBVietnamWest Bank and GazaWorldZambiaZimbabwe línea de tiempo (timeline):
En esta escala de tiempo se presenta un gráfico de 1982 y 2016 de Equatorial Guinea. Los datos de 1981 están ausentes. El número de observaciones reales por fecha: 35.
Fuente (nombre):
Indicadores del desarrollo mundial
Fuente (organización):
World Bank national accounts data, and OECD National Accounts data files.
Categorías:
Economy & Growth, Trade
Se ha actualizado:
23 abr 2017 año
Los indicadores de los cambios de valor en los últimos años
Mínimo:
-21.498
1 ene 1983 año
Máximo:
264.357
1 ene 1998 año
A la fecha de observación
Valor
Cambio absoluto
El cambio con respecto al valor anterior
1 ene 1982 año
37.801
+37.801
0.0%
1 ene 1983 año
-21.498
-59.299
-156.87%
1 ene 1984 año
14.79
+36.288
-168.8%
1 ene 1985 año
-2.873
-17.663
-119.43%
1 ene 1986 año
-15.614
-12.741
443.43%
1 ene 1987 año
16.209
+31.824
-203.81%
1 ene 1988 año
5.489
-10.72
-66.14%
1 ene 1989 año
10.386
+4.897
89.21%
1 ene 1990 año
-9.168
-19.554
-188.27%
1 ene 1991 año
-19.075
-9.907
108.06%
1 ene 1992 año
2.111
+21.186
-111.07%
1 ene 1993 año
48.178
+46.067
2.18 mil%
1 ene 1994 año
33.509
-14.669
-30.45%
1 ene 1995 año
46.901
+13.392
39.97%
1 ene 1996 año
20.214
-26.687
-56.9%
1 ene 1997 año
94.634
+74.419
368.15%
1 ene 1998 año
264.357
+169.723
179.35%
1 ene 1999 año
22.973
-241.384
-91.31%
1 ene 2000 año
34.004
+11.031
48.02%
1 ene 2001 año
16.704
-17.3
-50.88%
1 ene 2002 año
64.921
+48.217
288.66%
1 ene 2003 año
18.563
-46.359
-71.41%
1 ene 2004 año
15.555
-3.008
-16.2%
1 ene 2005 año
26.7
+11.145
71.65%
1 ene 2006 año
4.6
-22.1
-82.77%
1 ene 2007 año
-0.705
-5.305
-115.33%
1 ene 2008 año
23.942
+24.647
-3.5 mil%
1 ene 2009 año
15.382
-8.56
-35.75%
1 ene 2010 año
-6.118
-21.5
-139.77%
1 ene 2011 año
-0.159
+5.959
-97.4%
1 ene 2012 año
-10.705
-10.546
6.63 mil%
1 ene 2013 año
4.629
+15.334
-143.24%
1 ene 2014 año
-7.583
-12.212
-263.82%
1 ene 2015 año
0.484
+8.067
-106.38%
1 ene 2016 año
-1.042
-1.526
-315.29%
Ranking de los países por los datos estadísticos actuales


Comentarios: