29
/es/
es
AIzaSyAYiBZKx7MnpbEhh9jyipgxe19OcubqV5w
April 1, 2024
182025
Luxembourg
LUX
true
2
1
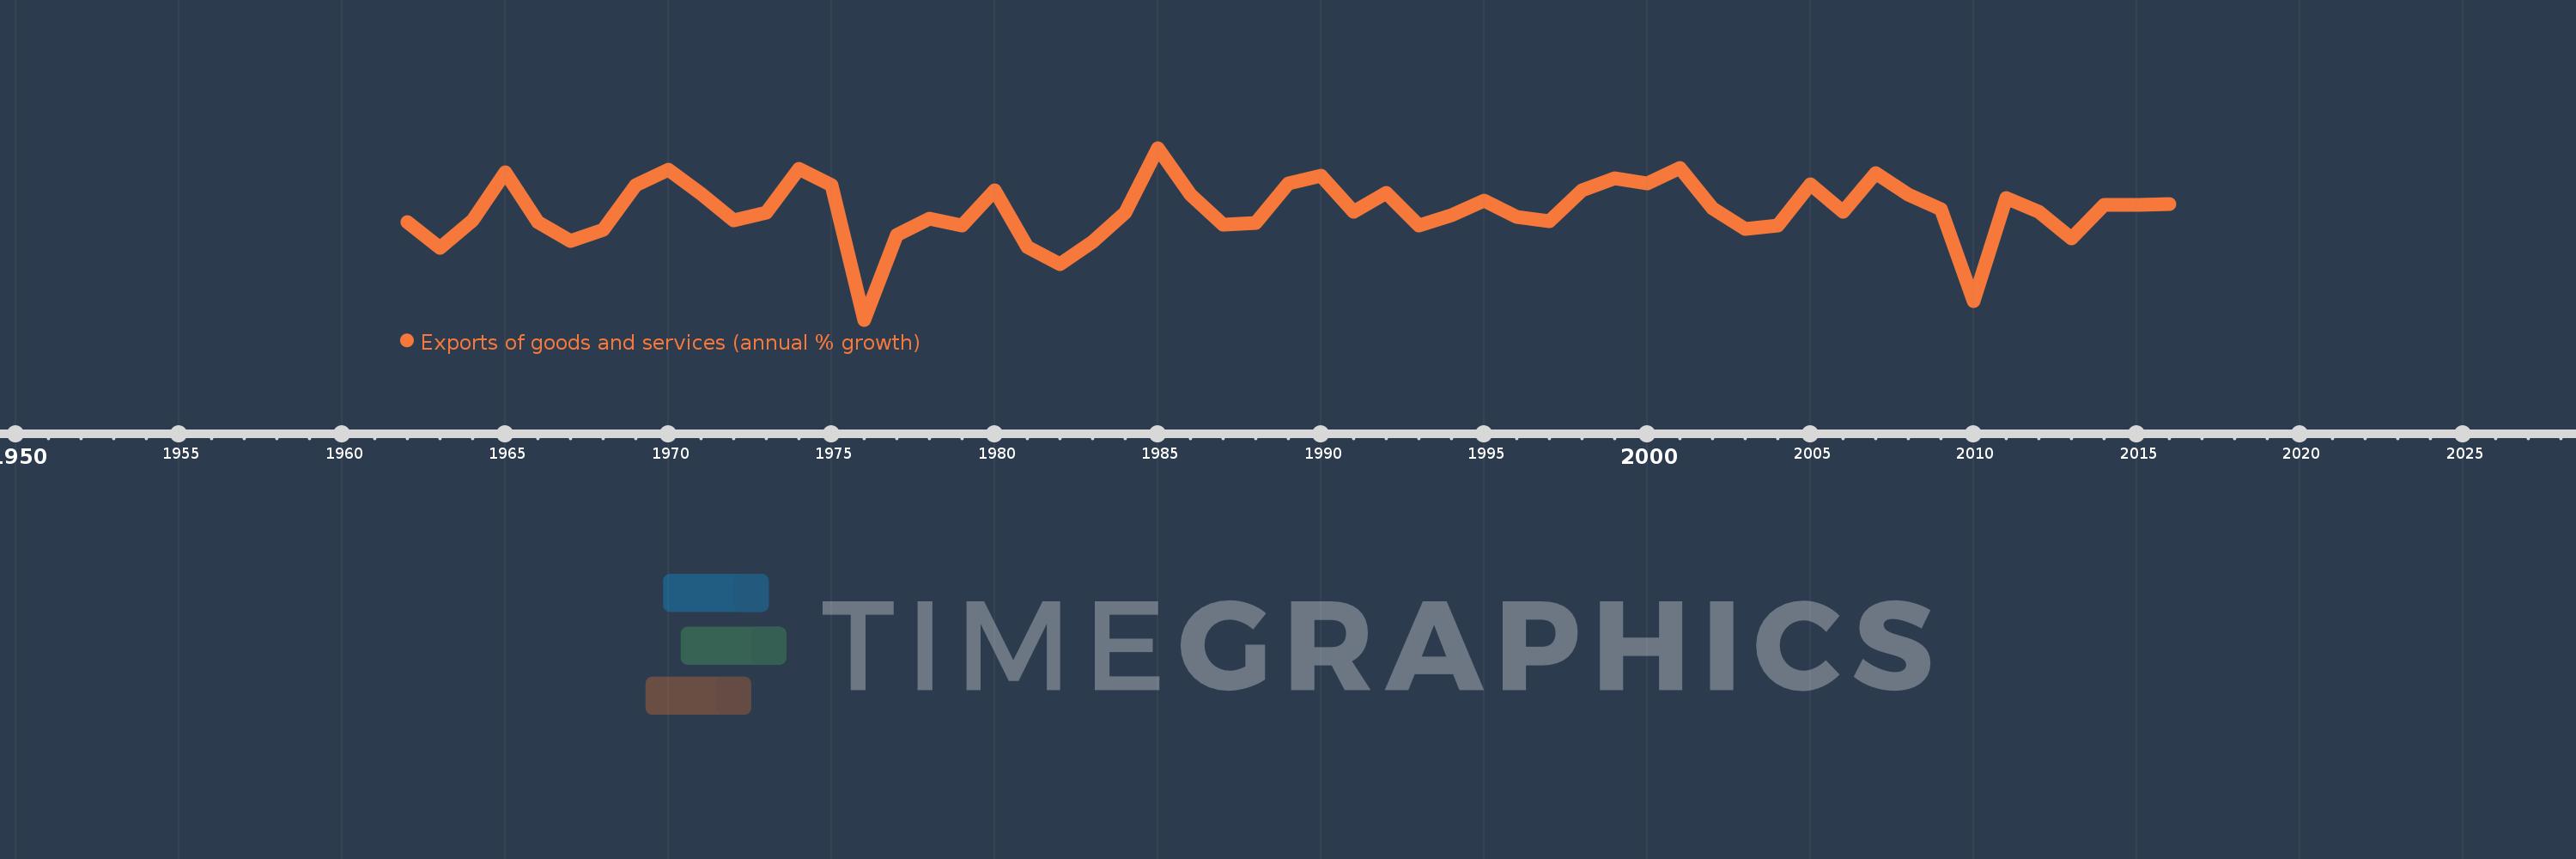
Exports of goods and services (annual % growth)
2016,2015,2014,2013,2012,2011,2010,2009,2008,2007,2006,2005,2004,2003,2002,2001,2000,1999,1998,1997,1996,1995,1994,1993,1992,1991,1990,1989,1988,1987,1986,1985,1984,1983,1982,1981,1980,1979,1978,1977,1976,1975,1974,1973,1972,1971,1970,1969,1968,1967,1966,1965,1964,1963,1962
Estas estadísticas en otros países:
AlbaniaAlgeriaAngolaAntigua and BarbudaArab WorldArgentinaArmeniaAustraliaAustriaAzerbaijanBahamas, TheBahrainBangladeshBarbadosBelarusBelgiumBelizeBeninBhutanBoliviaBosnia and HerzegovinaBotswanaBrazilBrunei DarussalamBulgariaBurkina FasoBurundiCabo VerdeCambodiaCameroonCanadaCaribbean small statesCentral Europe and the BalticsChadChileColombiaComorosCongo, Dem. Rep.Congo, Rep.Costa RicaCote d'IvoireCroatiaCubaCyprusCzech RepublicDenmarkDjiboutiDominican RepublicEarly-demographic dividendEast Asia & PacificEcuadorEgypt, Arab Rep.El SalvadorEquatorial GuineaEritreaEstoniaEthiopiaEuro areaEurope & Central AsiaEurope & Central Asia (excluding high income)Europe & Central Asia (IDA & IBRD countries)European UnionFijiFinlandFranceGabonGambia, TheGeorgiaGermanyGhanaGreeceGuatemalaGuineaGuinea-BissauHaitiHeavily indebted poor countries (HIPC)High incomeHondurasHong Kong SAR, ChinaHungaryIBRD onlyIcelandIDA & IBRD totalIDA blendIDA onlyIDA totalIndiaIndonesiaIran, Islamic Rep.IrelandIsraelItalyJamaicaJapanJordanKazakhstanKenyaKorea, Rep.KosovoKuwaitKyrgyz RepublicLao PDRLatin America & Caribbean Latin America & Caribbean (excluding high income)Latin America & the Caribbean (IDA & IBRD countries)LatviaLebanonLiberiaLibyaLithuaniaLow & middle incomeLow incomeLower middle incomeLuxembourgMacao SAR, ChinaMacedonia, FYRMadagascarMalawiMalaysiaMaliMaltaMauritaniaMauritiusMexicoMiddle East & North AfricaMiddle East & North Africa (excluding high income)Middle East & North Africa (IDA & IBRD countries)Middle incomeMoldovaMongoliaMontenegroMoroccoMozambiqueMyanmarNamibiaNepalNetherlandsNew ZealandNicaraguaNigerNigeriaNorth AmericaNorwayOECD membersOmanOther small statesPakistanPanamaPapua New GuineaParaguayPeruPhilippinesPolandPortugalPost-demographic dividendPre-demographic dividendPuerto RicoQatarRomaniaRussian FederationRwandaSamoaSaudi ArabiaSenegalSerbiaSeychellesSierra LeoneSingaporeSlovak RepublicSloveniaSmall statesSomaliaSouth AfricaSouth AsiaSouth Asia (IDA & IBRD)South SudanSpainSri LankaSub-Saharan Africa Sub-Saharan Africa (excluding high income)Sub-Saharan Africa (IDA & IBRD countries)SudanSurinameSwazilandSwedenSwitzerlandSyrian Arab RepublicTajikistanTanzaniaThailandTimor-LesteTogoTrinidad and TobagoTunisiaTurkeyTurkmenistanUgandaUkraineUnited Arab EmiratesUnited KingdomUnited StatesUruguayUzbekistanVanuatuVenezuela, RBVietnamWest Bank and GazaWorldZambiaZimbabwe línea de tiempo (timeline):
En esta escala de tiempo se presenta un gráfico de 1962 y 2016 de Luxembourg. Los datos de 1961 están ausentes. El número de observaciones reales por fecha: 55.
Fuente (nombre):
Indicadores del desarrollo mundial
Fuente (organización):
World Bank national accounts data, and OECD National Accounts data files.
Categorías:
Economy & Growth, Trade
Se ha actualizado:
23 abr 2017 año
Los indicadores de los cambios de valor en los últimos años
Mínimo:
-15.667
1 ene 1976 año
Máximo:
18.028
1 ene 1985 año
A la fecha de observación
Valor
Cambio absoluto
El cambio con respecto al valor anterior
1 ene 1962 año
3.485
+3.485
0.0%
1 ene 1963 año
-1.596
-5.081
-145.8%
1 ene 1964 año
3.775
+5.371
-336.54%
1 ene 1965 año
13.264
+9.489
251.36%
1 ene 1966 año
3.558
-9.705
-73.17%
1 ene 1967 año
-0.194
-3.752
-105.44%
1 ene 1968 año
1.941
+2.135
-1.1 mil%
1 ene 1969 año
10.738
+8.797
453.18%
1 ene 1970 año
13.768
+3.03
28.22%
1 ene 1971 año
9.11
-4.659
-33.84%
1 ene 1972 año
3.871
-5.238
-57.5%
1 ene 1973 año
5.281
+1.41
36.42%
1 ene 1974 año
13.89
+8.608
163.0%
1 ene 1975 año
10.747
-3.143
-22.63%
1 ene 1976 año
-15.667
-26.413
-245.78%
1 ene 1977 año
0.946
+16.613
-106.04%
1 ene 1978 año
4.235
+3.289
347.73%
1 ene 1979 año
2.748
-1.487
-35.1%
1 ene 1980 año
9.664
+6.916
251.68%
1 ene 1981 año
-1.448
-11.112
-114.98%
1 ene 1982 año
-4.823
-3.375
233.19%
1 ene 1983 año
-0.314
+4.51
-93.5%
1 ene 1984 año
5.29
+5.603
-1.79 mil%
1 ene 1985 año
18.028
+12.739
240.81%
1 ene 1986 año
8.797
-9.231
-51.2%
1 ene 1987 año
2.981
-5.816
-66.11%
1 ene 1988 año
3.32
+0.339
11.36%
1 ene 1989 año
11.073
+7.753
233.53%
1 ene 1990 año
12.588
+1.516
13.69%
1 ene 1991 año
5.587
-7.001
-55.62%
1 ene 1992 año
9.185
+3.598
64.4%
1 ene 1993 año
2.731
-6.454
-70.27%
1 ene 1994 año
4.759
+2.027
74.24%
1 ene 1995 año
7.69
+2.932
61.61%
1 ene 1996 año
4.571
-3.119
-40.56%
1 ene 1997 año
3.701
-0.87
-19.04%
1 ene 1998 año
9.755
+6.054
163.58%
1 ene 1999 año
12.099
+2.344
24.03%
1 ene 2000 año
11.127
-0.972
-8.03%
1 ene 2001 año
14.038
+2.911
26.16%
1 ene 2002 año
6.17
-7.868
-56.04%
1 ene 2003 año
2.094
-4.076
-66.06%
1 ene 2004 año
2.814
+0.72
34.38%
1 ene 2005 año
10.893
+8.079
287.1%
1 ene 2006 año
5.497
-5.396
-49.53%
1 ene 2007 año
13.023
+7.526
136.9%
1 ene 2008 año
8.855
-4.168
-32.01%
1 ene 2009 año
5.971
-2.884
-32.57%
1 ene 2010 año
-12.024
-17.995
-301.39%
1 ene 2011 año
8.289
+20.314
-168.94%
1 ene 2012 año
5.428
-2.861
-34.51%
1 ene 2013 año
0.216
-5.213
-96.02%
1 ene 2014 año
6.889
+6.673
3.09 mil%
1 ene 2015 año
6.802
-0.087
-1.26%
1 ene 2016 año
7.009
+0.207
3.04%
Ranking de los países por los datos estadísticos actuales


Comentarios: