29
/es/
es
AIzaSyAYiBZKx7MnpbEhh9jyipgxe19OcubqV5w
April 1, 2024
101033
Canada
CAN
true
2
1
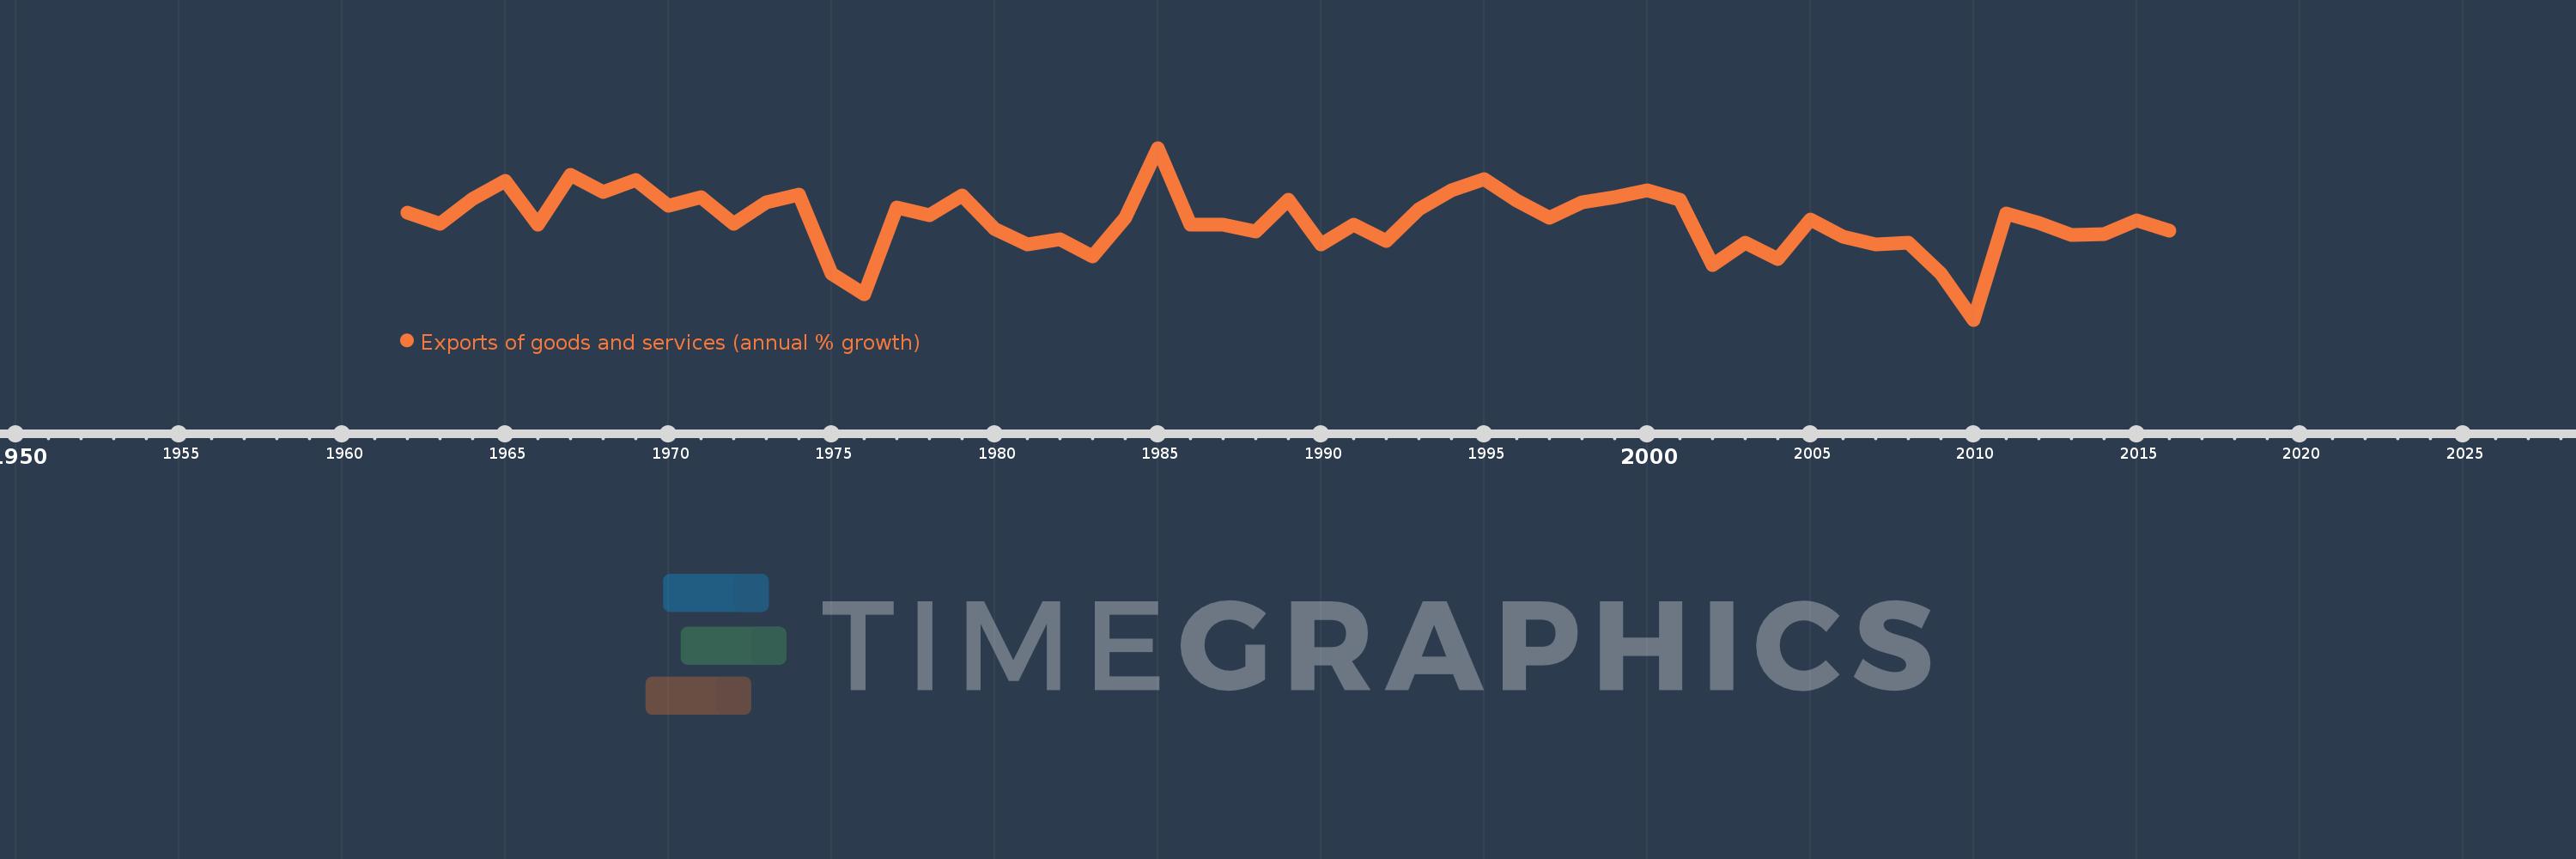
Exports of goods and services (annual % growth)
2016,2015,2014,2013,2012,2011,2010,2009,2008,2007,2006,2005,2004,2003,2002,2001,2000,1999,1998,1997,1996,1995,1994,1993,1992,1991,1990,1989,1988,1987,1986,1985,1984,1983,1982,1981,1980,1979,1978,1977,1976,1975,1974,1973,1972,1971,1970,1969,1968,1967,1966,1965,1964,1963,1962
Estas estadísticas en otros países:
AlbaniaAlgeriaAngolaAntigua and BarbudaArab WorldArgentinaArmeniaAustraliaAustriaAzerbaijanBahamas, TheBahrainBangladeshBarbadosBelarusBelgiumBelizeBeninBhutanBoliviaBosnia and HerzegovinaBotswanaBrazilBrunei DarussalamBulgariaBurkina FasoBurundiCabo VerdeCambodiaCameroonCanadaCaribbean small statesCentral Europe and the BalticsChadChileColombiaComorosCongo, Dem. Rep.Congo, Rep.Costa RicaCote d'IvoireCroatiaCubaCyprusCzech RepublicDenmarkDjiboutiDominican RepublicEarly-demographic dividendEast Asia & PacificEcuadorEgypt, Arab Rep.El SalvadorEquatorial GuineaEritreaEstoniaEthiopiaEuro areaEurope & Central AsiaEurope & Central Asia (excluding high income)Europe & Central Asia (IDA & IBRD countries)European UnionFijiFinlandFranceGabonGambia, TheGeorgiaGermanyGhanaGreeceGuatemalaGuineaGuinea-BissauHaitiHeavily indebted poor countries (HIPC)High incomeHondurasHong Kong SAR, ChinaHungaryIBRD onlyIcelandIDA & IBRD totalIDA blendIDA onlyIDA totalIndiaIndonesiaIran, Islamic Rep.IrelandIsraelItalyJamaicaJapanJordanKazakhstanKenyaKorea, Rep.KosovoKuwaitKyrgyz RepublicLao PDRLatin America & Caribbean Latin America & Caribbean (excluding high income)Latin America & the Caribbean (IDA & IBRD countries)LatviaLebanonLiberiaLibyaLithuaniaLow & middle incomeLow incomeLower middle incomeLuxembourgMacao SAR, ChinaMacedonia, FYRMadagascarMalawiMalaysiaMaliMaltaMauritaniaMauritiusMexicoMiddle East & North AfricaMiddle East & North Africa (excluding high income)Middle East & North Africa (IDA & IBRD countries)Middle incomeMoldovaMongoliaMontenegroMoroccoMozambiqueMyanmarNamibiaNepalNetherlandsNew ZealandNicaraguaNigerNigeriaNorth AmericaNorwayOECD membersOmanOther small statesPakistanPanamaPapua New GuineaParaguayPeruPhilippinesPolandPortugalPost-demographic dividendPre-demographic dividendPuerto RicoQatarRomaniaRussian FederationRwandaSamoaSaudi ArabiaSenegalSerbiaSeychellesSierra LeoneSingaporeSlovak RepublicSloveniaSmall statesSomaliaSouth AfricaSouth AsiaSouth Asia (IDA & IBRD)South SudanSpainSri LankaSub-Saharan Africa Sub-Saharan Africa (excluding high income)Sub-Saharan Africa (IDA & IBRD countries)SudanSurinameSwazilandSwedenSwitzerlandSyrian Arab RepublicTajikistanTanzaniaThailandTimor-LesteTogoTrinidad and TobagoTunisiaTurkeyTurkmenistanUgandaUkraineUnited Arab EmiratesUnited KingdomUnited StatesUruguayUzbekistanVanuatuVenezuela, RBVietnamWest Bank and GazaWorldZambiaZimbabwe línea de tiempo (timeline):
En esta escala de tiempo se presenta un gráfico de 1962 y 2016 de Canada. Los datos de 1961 están ausentes. El número de observaciones reales por fecha: 55.
Fuente (nombre):
Indicadores del desarrollo mundial
Fuente (organización):
World Bank national accounts data, and OECD National Accounts data files.
Categorías:
Economy & Growth, Trade
Se ha actualizado:
23 abr 2017 año
Los indicadores de los cambios de valor en los últimos años
Mínimo:
-12.993
1 ene 2010 año
Máximo:
18.632
1 ene 1985 año
A la fecha de observación
Valor
Cambio absoluto
El cambio con respecto al valor anterior
1 ene 1962 año
6.801
+6.801
0.0%
1 ene 1963 año
4.617
-2.184
-32.12%
1 ene 1964 año
9.223
+4.606
99.78%
1 ene 1965 año
12.627
+3.404
36.91%
1 ene 1966 año
4.571
-8.056
-63.8%
1 ene 1967 año
13.636
+9.065
198.32%
1 ene 1968 año
10.462
-3.174
-23.28%
1 ene 1969 año
12.775
+2.313
22.11%
1 ene 1970 año
8.055
-4.72
-36.95%
1 ene 1971 año
9.515
+1.46
18.12%
1 ene 1972 año
4.665
-4.85
-50.97%
1 ene 1973 año
8.594
+3.929
84.22%
1 ene 1974 año
10.014
+1.42
16.52%
1 ene 1975 año
-4.483
-14.497
-144.76%
1 ene 1976 año
-8.291
-3.808
84.95%
1 ene 1977 año
7.717
+16.007
-193.08%
1 ene 1978 año
6.313
-1.404
-18.2%
1 ene 1979 año
9.917
+3.604
57.09%
1 ene 1980 año
3.649
-6.268
-63.21%
1 ene 1981 año
0.953
-2.695
-73.88%
1 ene 1982 año
1.775
+0.822
86.27%
1 ene 1983 año
-1.413
-3.189
-179.6%
1 ene 1984 año
5.761
+7.174
-507.63%
1 ene 1985 año
18.632
+12.872
223.45%
1 ene 1986 año
4.462
-14.17
-76.05%
1 ene 1987 año
4.486
+0.024
0.54%
1 ene 1988 año
3.178
-1.308
-29.15%
1 ene 1989 año
9.1
+5.922
186.32%
1 ene 1990 año
0.826
-8.274
-90.92%
1 ene 1991 año
4.526
+3.699
447.64%
1 ene 1992 año
1.581
-2.945
-65.07%
1 ene 1993 año
7.424
+5.843
369.64%
1 ene 1994 año
10.828
+3.404
45.85%
1 ene 1995 año
12.839
+2.011
18.57%
1 ene 1996 año
8.871
-3.969
-30.91%
1 ene 1997 año
5.729
-3.141
-35.41%
1 ene 1998 año
8.598
+2.869
50.07%
1 ene 1999 año
9.516
+0.918
10.68%
1 ene 2000 año
10.833
+1.317
13.84%
1 ene 2001 año
9.055
-1.778
-16.41%
1 ene 2002 año
-2.988
-12.043
-132.99%
1 ene 2003 año
1.186
+4.174
-139.71%
1 ene 2004 año
-1.736
-2.922
-246.34%
1 ene 2005 año
5.539
+7.275
-419.04%
1 ene 2006 año
2.221
-3.318
-59.91%
1 ene 2007 año
0.866
-1.355
-61.02%
1 ene 2008 año
1.141
+0.275
31.78%
1 ene 2009 año
-4.556
-5.696
-499.37%
1 ene 2010 año
-12.993
-8.437
185.2%
1 ene 2011 año
6.646
+19.638
-151.15%
1 ene 2012 año
4.759
-1.887
-28.39%
1 ene 2013 año
2.642
-2.116
-44.47%
1 ene 2014 año
2.835
+0.192
7.28%
1 ene 2015 año
5.299
+2.464
86.94%
1 ene 2016 año
3.421
-1.878
-35.44%
Ranking de los países por los datos estadísticos actuales


Comentarios: