29
/de/
de
AIzaSyAYiBZKx7MnpbEhh9jyipgxe19OcubqV5w
April 1, 2024
54631
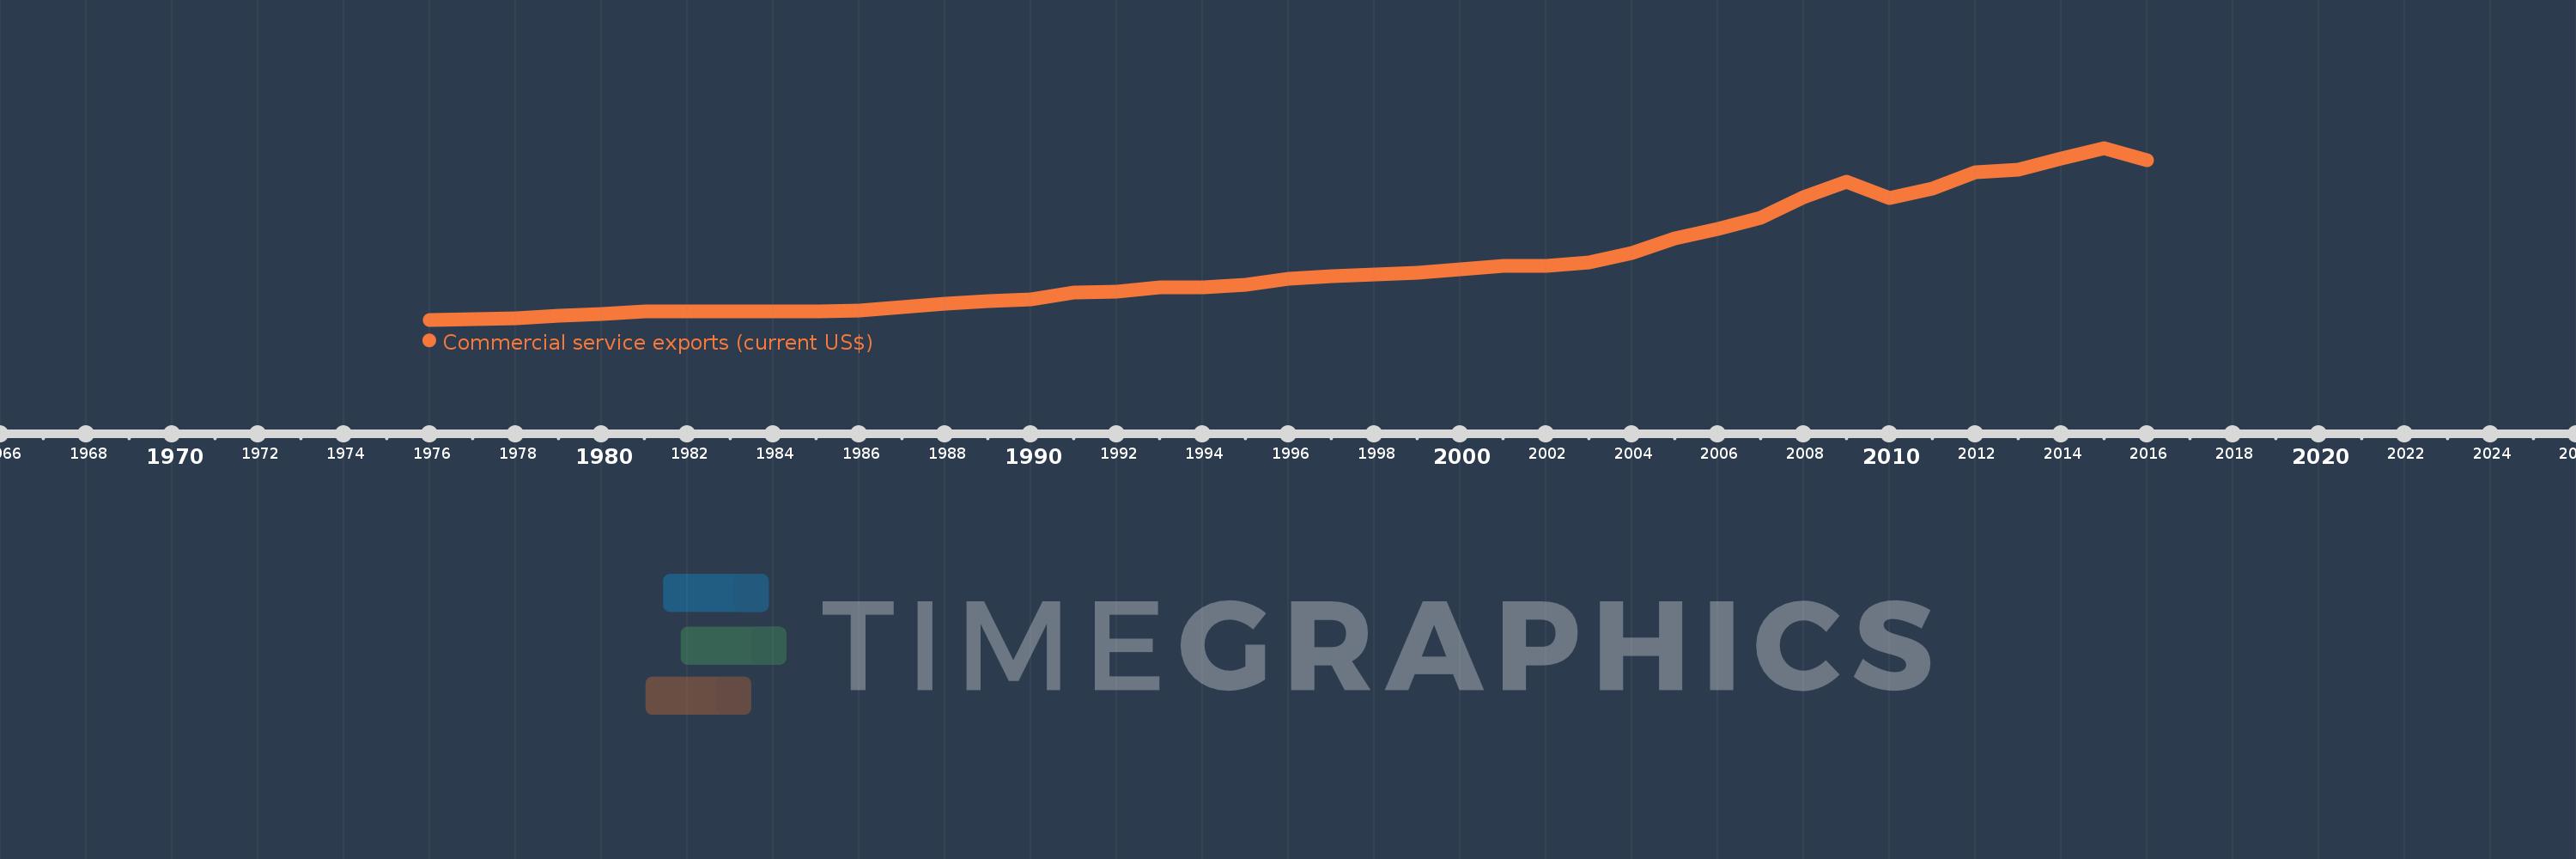
Post-demographic dividend
PST
false
2
1
Commercial service exports (current US$)
2016,2015,2014,2013,2012,2011,2010,2009,2008,2007,2006,2005,2004,2003,2002,2001,2000,1999,1998,1997,1996,1995,1994,1993,1992,1991,1990,1989,1988,1987,1986,1985,1984,1983,1982,1981,1980,1979,1978,1977,1976
Diese Statistik in anderen Ländern:
AfghanistanAlbaniaAlgeriaAngolaAntigua and BarbudaArab WorldArgentinaArmeniaArubaAustraliaAustriaAzerbaijanBahamas, TheBahrainBangladeshBarbadosBelarusBelgiumBelizeBeninBermudaBhutanBoliviaBosnia and HerzegovinaBotswanaBrazilBrunei DarussalamBulgariaBurkina FasoBurundiCabo VerdeCambodiaCameroonCanadaCaribbean small statesCentral African RepublicCentral Europe and the BalticsChadChileChinaColombiaComorosCongo, Dem. Rep.Congo, Rep.Costa RicaCote d'IvoireCroatiaCuracaoCyprusCzech RepublicDenmarkDjiboutiDominicaDominican RepublicEarly-demographic dividendEast Asia & PacificEast Asia & Pacific (excluding high income)East Asia & Pacific (IDA & IBRD countries)EcuadorEgypt, Arab Rep.El SalvadorEquatorial GuineaEritreaEstoniaEthiopiaEuro areaEurope & Central AsiaEurope & Central Asia (excluding high income)Europe & Central Asia (IDA & IBRD countries)European UnionFaroe IslandsFijiFinlandFragile and conflict affected situationsFranceFrench PolynesiaGabonGambia, TheGeorgiaGermanyGhanaGreeceGrenadaGuatemalaGuineaGuinea-BissauGuyanaHaitiHeavily indebted poor countries (HIPC)High incomeHondurasHong Kong SAR, ChinaHungaryIBRD onlyIcelandIDA & IBRD totalIDA blendIDA onlyIDA totalIndiaIndonesiaIran, Islamic Rep.IraqIrelandIsraelItalyJamaicaJapanJordanKazakhstanKenyaKiribatiKorea, Rep.KosovoKuwaitKyrgyz RepublicLao PDRLate-demographic dividendLatin America & Caribbean Latin America & Caribbean (excluding high income)Latin America & the Caribbean (IDA & IBRD countries)LatviaLeast developed countries: UN classificationLebanonLesothoLiberiaLibyaLithuaniaLow & middle incomeLow incomeLower middle incomeLuxembourgMacao SAR, ChinaMacedonia, FYRMadagascarMalawiMalaysiaMaldivesMaliMaltaMarshall IslandsMauritaniaMauritiusMexicoMicronesia, Fed. Sts.Middle East & North Africa (excluding high income)Middle East & North Africa (IDA & IBRD countries)Middle incomeMoldovaMongoliaMontenegroMoroccoMozambiqueMyanmarNamibiaNepalNetherlandsNew CaledoniaNew ZealandNicaraguaNigerNigeriaNorth AmericaNorwayOECD membersOmanPacific island small statesPakistanPalauPanamaPapua New GuineaParaguayPeruPhilippinesPolandPortugalPost-demographic dividendPre-demographic dividendQatarRomaniaRussian FederationRwandaSamoaSao Tome and PrincipeSaudi ArabiaSenegalSerbiaSeychellesSierra LeoneSingaporeSint Maarten (Dutch part)Slovak RepublicSloveniaSolomon IslandsSouth AfricaSouth AsiaSouth Asia (IDA & IBRD)South SudanSpainSri LankaSt. Kitts and NevisSt. LuciaSt. Vincent and the GrenadinesSub-Saharan Africa Sub-Saharan Africa (excluding high income)Sub-Saharan Africa (IDA & IBRD countries)SudanSurinameSwazilandSwedenSwitzerlandSyrian Arab RepublicTajikistanTanzaniaThailandTimor-LesteTogoTongaTrinidad and TobagoTunisiaTurkeyTuvaluUgandaUkraineUnited KingdomUnited StatesUpper middle incomeUruguayVanuatuVenezuela, RBVietnamWest Bank and GazaWorldYemen, Rep.ZambiaZimbabwe Zeitlinie:
Diese Zeitleiste vorliegt die Graphik ab 1976 J. bis 2016 J. Post-demographic dividend. Die Angaben bis 1975 J. sind nicht vorhanden. Die Zahl aktueller Beobachtungen nach Daten: 41.
Die Quelle (Bezeichnung):
Kennzahlen der Weltentwicklung
Die Quelle (Einrichtung):
International Monetary Fund, Balance of Payments Statistics Yearbook and data files.
Kategorien:
Private Sector, Trade
Es wurde aktualisiert:
23 Apr 2017 Jahr
Kennzahlen der Wertänderungen vom Jahr zum Jahr
im Durchschnitt:
1.278 Trln
Minimum:
134.237 Mlrd.
1 Jan 1976 Jahr
Maximum:
3.601 Trln
1 Jan 2015 Jahr
Zum Datum der Beobachtung
Wert
Absolute Veränderung
Die Veränderung bezüglich dem vorherigen Wert
1 Jan 1976 Jahr
134.237 Mlrd.
+134.237 Mlrd.
0.0%
1 Jan 1977 Jahr
148.907 Mlrd.
+14.67 Mlrd.
10.93%
1 Jan 1978 Jahr
171.801 Mlrd.
+22.894 Mlrd.
15.37%
1 Jan 1979 Jahr
210.77 Mlrd.
+38.969 Mlrd.
22.68%
1 Jan 1980 Jahr
255.138 Mlrd.
+44.367 Mlrd.
21.05%
1 Jan 1981 Jahr
305.13 Mlrd.
+49.992 Mlrd.
19.59%
1 Jan 1982 Jahr
307.376 Mlrd.
+2.246 Mlrd.
0.74%
1 Jan 1983 Jahr
307.734 Mlrd.
+357.904 Mln.
0.12%
1 Jan 1984 Jahr
299.544 Mlrd.
-8.19 Mlrd.
-2.66%
1 Jan 1985 Jahr
307.487 Mlrd.
+7.943 Mlrd.
2.65%
1 Jan 1986 Jahr
320.137 Mlrd.
+12.649 Mlrd.
4.11%
1 Jan 1987 Jahr
387.255 Mlrd.
+67.119 Mlrd.
20.97%
1 Jan 1988 Jahr
459.827 Mlrd.
+72.572 Mlrd.
18.74%
1 Jan 1989 Jahr
509.942 Mlrd.
+50.115 Mlrd.
10.9%
1 Jan 1990 Jahr
550.715 Mlrd.
+40.773 Mlrd.
8.0%
1 Jan 1991 Jahr
677.199 Mlrd.
+126.484 Mlrd.
22.97%
1 Jan 1992 Jahr
709.538 Mlrd.
+32.338 Mlrd.
4.78%
1 Jan 1993 Jahr
792.946 Mlrd.
+83.409 Mlrd.
11.76%
1 Jan 1994 Jahr
783.091 Mlrd.
-9.855 Mlrd.
-1.24%
1 Jan 1995 Jahr
843.752 Mlrd.
+60.661 Mlrd.
7.75%
1 Jan 1996 Jahr
954.67 Mlrd.
+110.917 Mlrd.
13.15%
1 Jan 1997 Jahr
1.02 Trln
+64.949 Mlrd.
6.8%
1 Jan 1998 Jahr
1.05 Trln
+30.436 Mlrd.
2.99%
1 Jan 1999 Jahr
1.083 Trln
+32.583 Mlrd.
3.1%
1 Jan 2000 Jahr
1.156 Trln
+73.328 Mlrd.
6.77%
1 Jan 2001 Jahr
1.219 Trln
+62.698 Mlrd.
5.42%
1 Jan 2002 Jahr
1.212 Trln
-6.287 Mlrd.
-0.52%
1 Jan 2003 Jahr
1.297 Trln
+84.212 Mlrd.
6.95%
1 Jan 2004 Jahr
1.478 Trln
+181.093 Mlrd.
13.97%
1 Jan 2005 Jahr
1.784 Trln
+306.114 Mlrd.
20.72%
1 Jan 2006 Jahr
1.96 Trln
+176.466 Mlrd.
9.89%
1 Jan 2007 Jahr
2.193 Trln
+232.805 Mlrd.
11.88%
1 Jan 2008 Jahr
2.602 Trln
+408.436 Mlrd.
18.62%
1 Jan 2009 Jahr
2.911 Trln
+309.869 Mlrd.
11.91%
1 Jan 2010 Jahr
2.591 Trln
-320.057 Mlrd.
-10.99%
1 Jan 2011 Jahr
2.776 Trln
+184.499 Mlrd.
7.12%
1 Jan 2012 Jahr
3.11 Trln
+334.524 Mlrd.
12.05%
1 Jan 2013 Jahr
3.168 Trln
+57.826 Mlrd.
1.86%
1 Jan 2014 Jahr
3.381 Trln
+212.76 Mlrd.
6.72%
1 Jan 2015 Jahr
3.601 Trln
+219.897 Mlrd.
6.5%
1 Jan 2016 Jahr
3.35 Trln
-251.245 Mlrd.
-6.98%
Bewertung der Länder gemäß mit laufender Statistik nach Jahren


Kommentare: