29
/de/
de
AIzaSyAYiBZKx7MnpbEhh9jyipgxe19OcubqV5w
April 1, 2024
161291
Italy
ITA
true
2
1
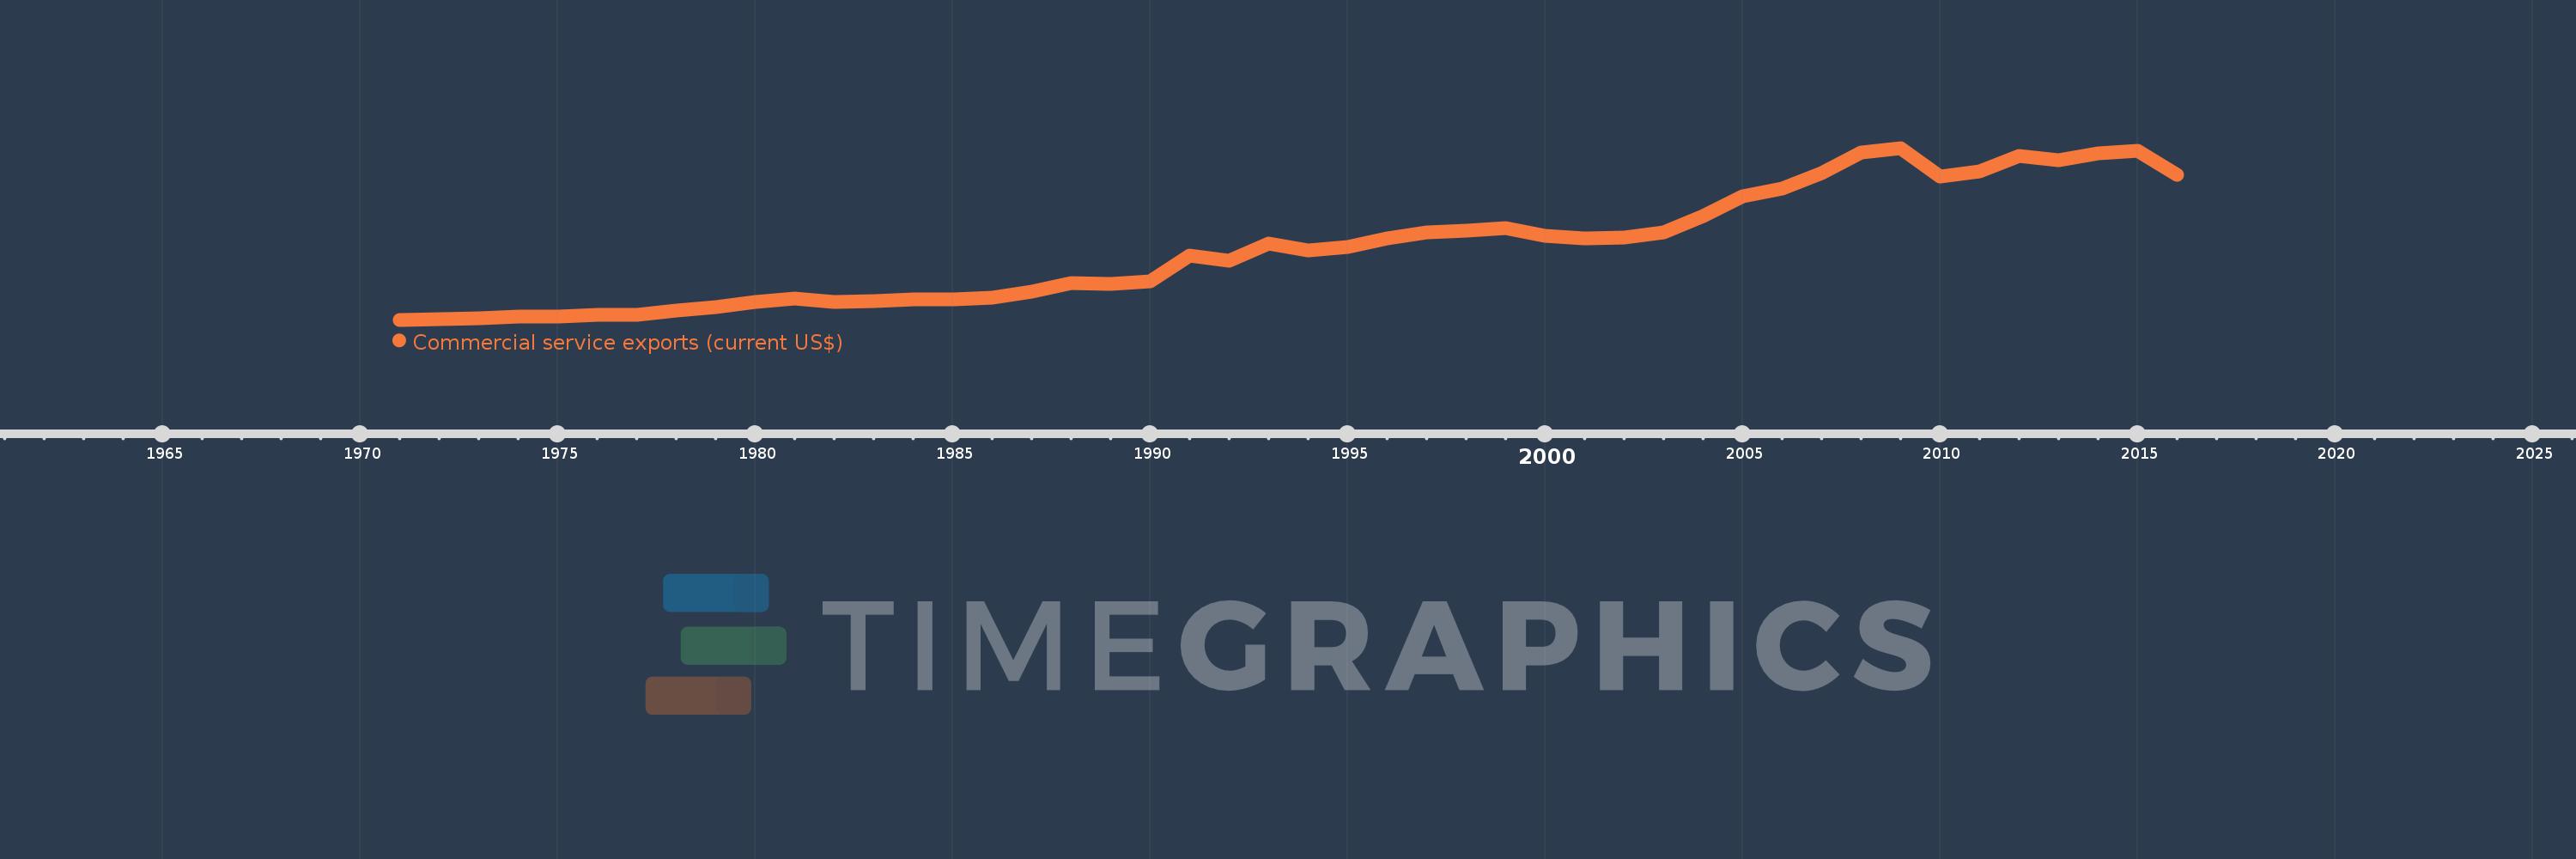
Commercial service exports (current US$)
2016,2015,2014,2013,2012,2011,2010,2009,2008,2007,2006,2005,2004,2003,2002,2001,2000,1999,1998,1997,1996,1995,1994,1993,1992,1991,1990,1989,1988,1987,1986,1985,1984,1983,1982,1981,1980,1979,1978,1977,1976,1975,1974,1973,1972,1971
Diese Statistik in anderen Ländern:
AfghanistanAlbaniaAlgeriaAngolaAntigua and BarbudaArab WorldArgentinaArmeniaArubaAustraliaAustriaAzerbaijanBahamas, TheBahrainBangladeshBarbadosBelarusBelgiumBelizeBeninBermudaBhutanBoliviaBosnia and HerzegovinaBotswanaBrazilBrunei DarussalamBulgariaBurkina FasoBurundiCabo VerdeCambodiaCameroonCanadaCaribbean small statesCentral African RepublicCentral Europe and the BalticsChadChileChinaColombiaComorosCongo, Dem. Rep.Congo, Rep.Costa RicaCote d'IvoireCroatiaCuracaoCyprusCzech RepublicDenmarkDjiboutiDominicaDominican RepublicEarly-demographic dividendEast Asia & PacificEast Asia & Pacific (excluding high income)East Asia & Pacific (IDA & IBRD countries)EcuadorEgypt, Arab Rep.El SalvadorEquatorial GuineaEritreaEstoniaEthiopiaEuro areaEurope & Central AsiaEurope & Central Asia (excluding high income)Europe & Central Asia (IDA & IBRD countries)European UnionFaroe IslandsFijiFinlandFragile and conflict affected situationsFranceFrench PolynesiaGabonGambia, TheGeorgiaGermanyGhanaGreeceGrenadaGuatemalaGuineaGuinea-BissauGuyanaHaitiHeavily indebted poor countries (HIPC)High incomeHondurasHong Kong SAR, ChinaHungaryIBRD onlyIcelandIDA & IBRD totalIDA blendIDA onlyIDA totalIndiaIndonesiaIran, Islamic Rep.IraqIrelandIsraelItalyJamaicaJapanJordanKazakhstanKenyaKiribatiKorea, Rep.KosovoKuwaitKyrgyz RepublicLao PDRLate-demographic dividendLatin America & Caribbean Latin America & Caribbean (excluding high income)Latin America & the Caribbean (IDA & IBRD countries)LatviaLeast developed countries: UN classificationLebanonLesothoLiberiaLibyaLithuaniaLow & middle incomeLow incomeLower middle incomeLuxembourgMacao SAR, ChinaMacedonia, FYRMadagascarMalawiMalaysiaMaldivesMaliMaltaMarshall IslandsMauritaniaMauritiusMexicoMicronesia, Fed. Sts.Middle East & North Africa (excluding high income)Middle East & North Africa (IDA & IBRD countries)Middle incomeMoldovaMongoliaMontenegroMoroccoMozambiqueMyanmarNamibiaNepalNetherlandsNew CaledoniaNew ZealandNicaraguaNigerNigeriaNorth AmericaNorwayOECD membersOmanPacific island small statesPakistanPalauPanamaPapua New GuineaParaguayPeruPhilippinesPolandPortugalPost-demographic dividendPre-demographic dividendQatarRomaniaRussian FederationRwandaSamoaSao Tome and PrincipeSaudi ArabiaSenegalSerbiaSeychellesSierra LeoneSingaporeSint Maarten (Dutch part)Slovak RepublicSloveniaSolomon IslandsSouth AfricaSouth AsiaSouth Asia (IDA & IBRD)South SudanSpainSri LankaSt. Kitts and NevisSt. LuciaSt. Vincent and the GrenadinesSub-Saharan Africa Sub-Saharan Africa (excluding high income)Sub-Saharan Africa (IDA & IBRD countries)SudanSurinameSwazilandSwedenSwitzerlandSyrian Arab RepublicTajikistanTanzaniaThailandTimor-LesteTogoTongaTrinidad and TobagoTunisiaTurkeyTuvaluUgandaUkraineUnited KingdomUnited StatesUpper middle incomeUruguayVanuatuVenezuela, RBVietnamWest Bank and GazaWorldYemen, Rep.ZambiaZimbabwe Zeitlinie:
Diese Zeitleiste vorliegt die Graphik ab 1971 J. bis 2016 J. Italy. Die Angaben bis 1970 J. sind nicht vorhanden. Die Zahl aktueller Beobachtungen nach Daten: 46.
Die Quelle (Bezeichnung):
Kennzahlen der Weltentwicklung
Die Quelle (Einrichtung):
International Monetary Fund, Balance of Payments Statistics Yearbook and data files.
Kategorien:
Private Sector, Trade
Es wurde aktualisiert:
23 Apr 2017 Jahr
Kennzahlen der Wertänderungen vom Jahr zum Jahr
im Durchschnitt:
49.82 Mlrd.
Minimum:
3.718 Mlrd.
1 Jan 1971 Jahr
Maximum:
114.703 Mlrd.
1 Jan 2009 Jahr
Zum Datum der Beobachtung
Wert
Absolute Veränderung
Die Veränderung bezüglich dem vorherigen Wert
1 Jan 1971 Jahr
3.718 Mlrd.
+3.718 Mlrd.
0.0%
1 Jan 1972 Jahr
4.072 Mlrd.
+353.872 Mln.
9.52%
1 Jan 1973 Jahr
4.825 Mlrd.
+752.783 Mln.
18.49%
1 Jan 1974 Jahr
5.645 Mlrd.
+820.397 Mln.
17.0%
1 Jan 1975 Jahr
5.98 Mlrd.
+334.618 Mln.
5.93%
1 Jan 1976 Jahr
7.157 Mlrd.
+1.177 Mlrd.
19.67%
1 Jan 1977 Jahr
7.131 Mlrd.
-25.115 Mln.
-0.35%
1 Jan 1978 Jahr
9.417 Mlrd.
+2.285 Mlrd.
32.04%
1 Jan 1979 Jahr
11.851 Mlrd.
+2.434 Mlrd.
25.85%
1 Jan 1980 Jahr
15.24 Mlrd.
+3.389 Mlrd.
28.6%
1 Jan 1981 Jahr
17.34 Mlrd.
+2.1 Mlrd.
13.78%
1 Jan 1982 Jahr
15.158 Mlrd.
-2.182 Mlrd.
-12.59%
1 Jan 1983 Jahr
15.933 Mlrd.
+775.056 Mln.
5.11%
1 Jan 1984 Jahr
16.62 Mlrd.
+687.207 Mln.
4.31%
1 Jan 1985 Jahr
16.688 Mlrd.
+68.537 Mln.
0.41%
1 Jan 1986 Jahr
18.207 Mlrd.
+1.519 Mlrd.
9.1%
1 Jan 1987 Jahr
21.877 Mlrd.
+3.67 Mlrd.
20.15%
1 Jan 1988 Jahr
27.138 Mlrd.
+5.261 Mlrd.
24.05%
1 Jan 1989 Jahr
27.114 Mlrd.
-24.198 Mln.
-0.09%
1 Jan 1990 Jahr
28.71 Mlrd.
+1.597 Mlrd.
5.89%
1 Jan 1991 Jahr
45.146 Mlrd.
+16.436 Mlrd.
57.25%
1 Jan 1992 Jahr
41.788 Mlrd.
-3.359 Mlrd.
-7.44%
1 Jan 1993 Jahr
53.04 Mlrd.
+11.252 Mlrd.
26.93%
1 Jan 1994 Jahr
48.384 Mlrd.
-4.655 Mlrd.
-8.78%
1 Jan 1995 Jahr
50.503 Mlrd.
+2.119 Mlrd.
4.38%
1 Jan 1996 Jahr
56.481 Mlrd.
+5.978 Mlrd.
11.84%
1 Jan 1997 Jahr
60.07 Mlrd.
+3.588 Mlrd.
6.35%
1 Jan 1998 Jahr
61.394 Mlrd.
+1.325 Mlrd.
2.21%
1 Jan 1999 Jahr
62.861 Mlrd.
+1.467 Mlrd.
2.39%
1 Jan 2000 Jahr
58.195 Mlrd.
-4.666 Mlrd.
-7.42%
1 Jan 2001 Jahr
56.145 Mlrd.
-2.05 Mlrd.
-3.52%
1 Jan 2002 Jahr
57.003 Mlrd.
+857.802 Mln.
1.53%
1 Jan 2003 Jahr
60.049 Mlrd.
+3.047 Mlrd.
5.34%
1 Jan 2004 Jahr
70.947 Mlrd.
+10.898 Mlrd.
18.15%
1 Jan 2005 Jahr
83.218 Mlrd.
+12.271 Mlrd.
17.3%
1 Jan 2006 Jahr
88.579 Mlrd.
+5.361 Mlrd.
6.44%
1 Jan 2007 Jahr
98.562 Mlrd.
+9.983 Mlrd.
11.27%
1 Jan 2008 Jahr
111.603 Mlrd.
+13.041 Mlrd.
13.23%
1 Jan 2009 Jahr
114.703 Mlrd.
+3.1 Mlrd.
2.78%
1 Jan 2010 Jahr
95.994 Mlrd.
-18.708 Mlrd.
-16.31%
1 Jan 2011 Jahr
99.489 Mlrd.
+3.495 Mlrd.
3.64%
1 Jan 2012 Jahr
109.375 Mlrd.
+9.886 Mlrd.
9.94%
1 Jan 2013 Jahr
106.856 Mlrd.
-2.519 Mlrd.
-2.3%
1 Jan 2014 Jahr
111.008 Mlrd.
+4.152 Mlrd.
3.89%
1 Jan 2015 Jahr
113.145 Mlrd.
+2.137 Mlrd.
1.93%
1 Jan 2016 Jahr
97.344 Mlrd.
-15.801 Mlrd.
-13.97%
Bewertung der Länder gemäß mit laufender Statistik nach Jahren


Kommentare: