29
/de/
de
AIzaSyAYiBZKx7MnpbEhh9jyipgxe19OcubqV5w
April 1, 2024
30528
Europe & Central Asia
ECS
false
2
1
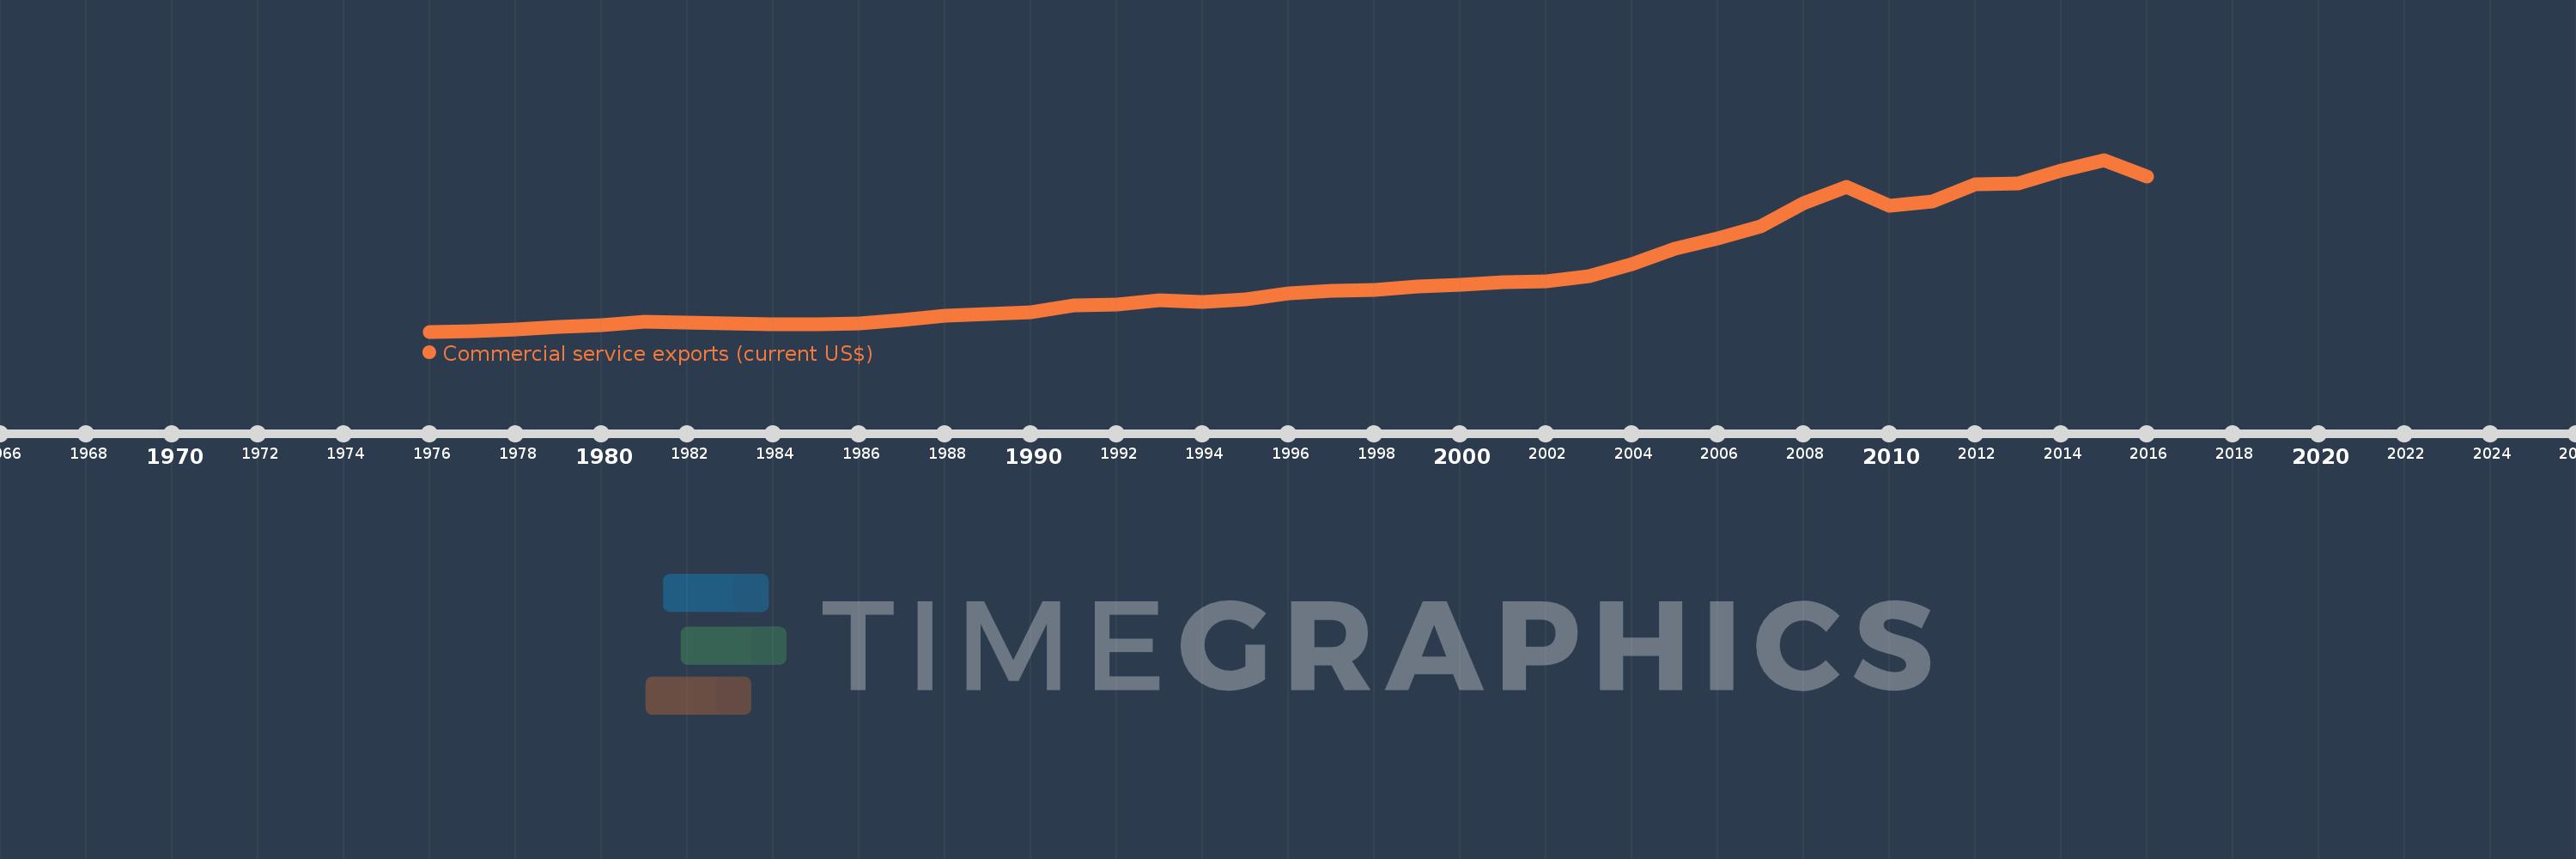
Commercial service exports (current US$)
2016,2015,2014,2013,2012,2011,2010,2009,2008,2007,2006,2005,2004,2003,2002,2001,2000,1999,1998,1997,1996,1995,1994,1993,1992,1991,1990,1989,1988,1987,1986,1985,1984,1983,1982,1981,1980,1979,1978,1977,1976
Diese Statistik in anderen Ländern:
AfghanistanAlbaniaAlgeriaAngolaAntigua and BarbudaArab WorldArgentinaArmeniaArubaAustraliaAustriaAzerbaijanBahamas, TheBahrainBangladeshBarbadosBelarusBelgiumBelizeBeninBermudaBhutanBoliviaBosnia and HerzegovinaBotswanaBrazilBrunei DarussalamBulgariaBurkina FasoBurundiCabo VerdeCambodiaCameroonCanadaCaribbean small statesCentral African RepublicCentral Europe and the BalticsChadChileChinaColombiaComorosCongo, Dem. Rep.Congo, Rep.Costa RicaCote d'IvoireCroatiaCuracaoCyprusCzech RepublicDenmarkDjiboutiDominicaDominican RepublicEarly-demographic dividendEast Asia & PacificEast Asia & Pacific (excluding high income)East Asia & Pacific (IDA & IBRD countries)EcuadorEgypt, Arab Rep.El SalvadorEquatorial GuineaEritreaEstoniaEthiopiaEuro areaEurope & Central AsiaEurope & Central Asia (excluding high income)Europe & Central Asia (IDA & IBRD countries)European UnionFaroe IslandsFijiFinlandFragile and conflict affected situationsFranceFrench PolynesiaGabonGambia, TheGeorgiaGermanyGhanaGreeceGrenadaGuatemalaGuineaGuinea-BissauGuyanaHaitiHeavily indebted poor countries (HIPC)High incomeHondurasHong Kong SAR, ChinaHungaryIBRD onlyIcelandIDA & IBRD totalIDA blendIDA onlyIDA totalIndiaIndonesiaIran, Islamic Rep.IraqIrelandIsraelItalyJamaicaJapanJordanKazakhstanKenyaKiribatiKorea, Rep.KosovoKuwaitKyrgyz RepublicLao PDRLate-demographic dividendLatin America & Caribbean Latin America & Caribbean (excluding high income)Latin America & the Caribbean (IDA & IBRD countries)LatviaLeast developed countries: UN classificationLebanonLesothoLiberiaLibyaLithuaniaLow & middle incomeLow incomeLower middle incomeLuxembourgMacao SAR, ChinaMacedonia, FYRMadagascarMalawiMalaysiaMaldivesMaliMaltaMarshall IslandsMauritaniaMauritiusMexicoMicronesia, Fed. Sts.Middle East & North Africa (excluding high income)Middle East & North Africa (IDA & IBRD countries)Middle incomeMoldovaMongoliaMontenegroMoroccoMozambiqueMyanmarNamibiaNepalNetherlandsNew CaledoniaNew ZealandNicaraguaNigerNigeriaNorth AmericaNorwayOECD membersOmanPacific island small statesPakistanPalauPanamaPapua New GuineaParaguayPeruPhilippinesPolandPortugalPost-demographic dividendPre-demographic dividendQatarRomaniaRussian FederationRwandaSamoaSao Tome and PrincipeSaudi ArabiaSenegalSerbiaSeychellesSierra LeoneSingaporeSint Maarten (Dutch part)Slovak RepublicSloveniaSolomon IslandsSouth AfricaSouth AsiaSouth Asia (IDA & IBRD)South SudanSpainSri LankaSt. Kitts and NevisSt. LuciaSt. Vincent and the GrenadinesSub-Saharan Africa Sub-Saharan Africa (excluding high income)Sub-Saharan Africa (IDA & IBRD countries)SudanSurinameSwazilandSwedenSwitzerlandSyrian Arab RepublicTajikistanTanzaniaThailandTimor-LesteTogoTongaTrinidad and TobagoTunisiaTurkeyTuvaluUgandaUkraineUnited KingdomUnited StatesUpper middle incomeUruguayVanuatuVenezuela, RBVietnamWest Bank and GazaWorldYemen, Rep.ZambiaZimbabwe Zeitlinie:
Diese Zeitleiste vorliegt die Graphik ab 1976 J. bis 2016 J. Europe & Central Asia. Die Angaben bis 1975 J. sind nicht vorhanden. Die Zahl aktueller Beobachtungen nach Daten: 41.
Die Quelle (Bezeichnung):
Kennzahlen der Weltentwicklung
Die Quelle (Einrichtung):
International Monetary Fund, Balance of Payments Statistics Yearbook and data files.
Kategorien:
Private Sector, Trade
Es wurde aktualisiert:
23 Apr 2017 Jahr
Kennzahlen der Wertänderungen vom Jahr zum Jahr
im Durchschnitt:
896.541 Mlrd.
Minimum:
102.468 Mlrd.
1 Jan 1976 Jahr
Maximum:
2.53 Trln
1 Jan 2015 Jahr
Zum Datum der Beobachtung
Wert
Absolute Veränderung
Die Veränderung bezüglich dem vorherigen Wert
1 Jan 1976 Jahr
102.468 Mlrd.
+102.468 Mlrd.
0.0%
1 Jan 1977 Jahr
112.684 Mlrd.
+10.215 Mlrd.
9.97%
1 Jan 1978 Jahr
131.784 Mlrd.
+19.1 Mlrd.
16.95%
1 Jan 1979 Jahr
163.342 Mlrd.
+31.558 Mlrd.
23.95%
1 Jan 1980 Jahr
199.49 Mlrd.
+36.148 Mlrd.
22.13%
1 Jan 1981 Jahr
237.58 Mlrd.
+38.09 Mlrd.
19.09%
1 Jan 1982 Jahr
225.059 Mlrd.
-12.52 Mlrd.
-5.27%
1 Jan 1983 Jahr
218.276 Mlrd.
-6.784 Mlrd.
-3.01%
1 Jan 1984 Jahr
210.054 Mlrd.
-8.222 Mlrd.
-3.77%
1 Jan 1985 Jahr
208.399 Mlrd.
-1.655 Mlrd.
-0.79%
1 Jan 1986 Jahr
220.192 Mlrd.
+11.793 Mlrd.
5.66%
1 Jan 1987 Jahr
270.437 Mlrd.
+50.245 Mlrd.
22.82%
1 Jan 1988 Jahr
326.624 Mlrd.
+56.186 Mlrd.
20.78%
1 Jan 1989 Jahr
355.511 Mlrd.
+28.887 Mlrd.
8.84%
1 Jan 1990 Jahr
372.031 Mlrd.
+16.52 Mlrd.
4.65%
1 Jan 1991 Jahr
469.723 Mlrd.
+97.692 Mlrd.
26.26%
1 Jan 1992 Jahr
480.435 Mlrd.
+10.712 Mlrd.
2.28%
1 Jan 1993 Jahr
548.74 Mlrd.
+68.305 Mlrd.
14.22%
1 Jan 1994 Jahr
523.659 Mlrd.
-25.081 Mlrd.
-4.57%
1 Jan 1995 Jahr
556.498 Mlrd.
+32.839 Mlrd.
6.27%
1 Jan 1996 Jahr
641.381 Mlrd.
+84.882 Mlrd.
15.25%
1 Jan 1997 Jahr
676.001 Mlrd.
+34.621 Mlrd.
5.4%
1 Jan 1998 Jahr
689.65 Mlrd.
+13.648 Mlrd.
2.02%
1 Jan 1999 Jahr
734.692 Mlrd.
+45.042 Mlrd.
6.53%
1 Jan 2000 Jahr
768.003 Mlrd.
+33.312 Mlrd.
4.53%
1 Jan 2001 Jahr
796.679 Mlrd.
+28.676 Mlrd.
3.73%
1 Jan 2002 Jahr
815.533 Mlrd.
+18.854 Mlrd.
2.37%
1 Jan 2003 Jahr
891.156 Mlrd.
+75.622 Mlrd.
9.27%
1 Jan 2004 Jahr
1.055 Trln
+164.199 Mlrd.
18.43%
1 Jan 2005 Jahr
1.28 Trln
+224.373 Mlrd.
21.26%
1 Jan 2006 Jahr
1.419 Trln
+139.227 Mlrd.
10.88%
1 Jan 2007 Jahr
1.595 Trln
+176.169 Mlrd.
12.42%
1 Jan 2008 Jahr
1.912 Trln
+316.958 Mlrd.
19.87%
1 Jan 2009 Jahr
2.149 Trln
+236.962 Mlrd.
12.39%
1 Jan 2010 Jahr
1.876 Trln
-272.919 Mlrd.
-12.7%
1 Jan 2011 Jahr
1.94 Trln
+63.58 Mlrd.
3.39%
1 Jan 2012 Jahr
2.188 Trln
+248.76 Mlrd.
12.82%
1 Jan 2013 Jahr
2.195 Trln
+6.156 Mlrd.
0.28%
1 Jan 2014 Jahr
2.376 Trln
+181.468 Mlrd.
8.27%
1 Jan 2015 Jahr
2.53 Trln
+154.315 Mlrd.
6.49%
1 Jan 2016 Jahr
2.296 Trln
-234.0 Mlrd.
-9.25%
Bewertung der Länder gemäß mit laufender Statistik nach Jahren


Kommentare: