29
/de/
de
AIzaSyAYiBZKx7MnpbEhh9jyipgxe19OcubqV5w
April 1, 2024
133924
France
FRA
true
2
1
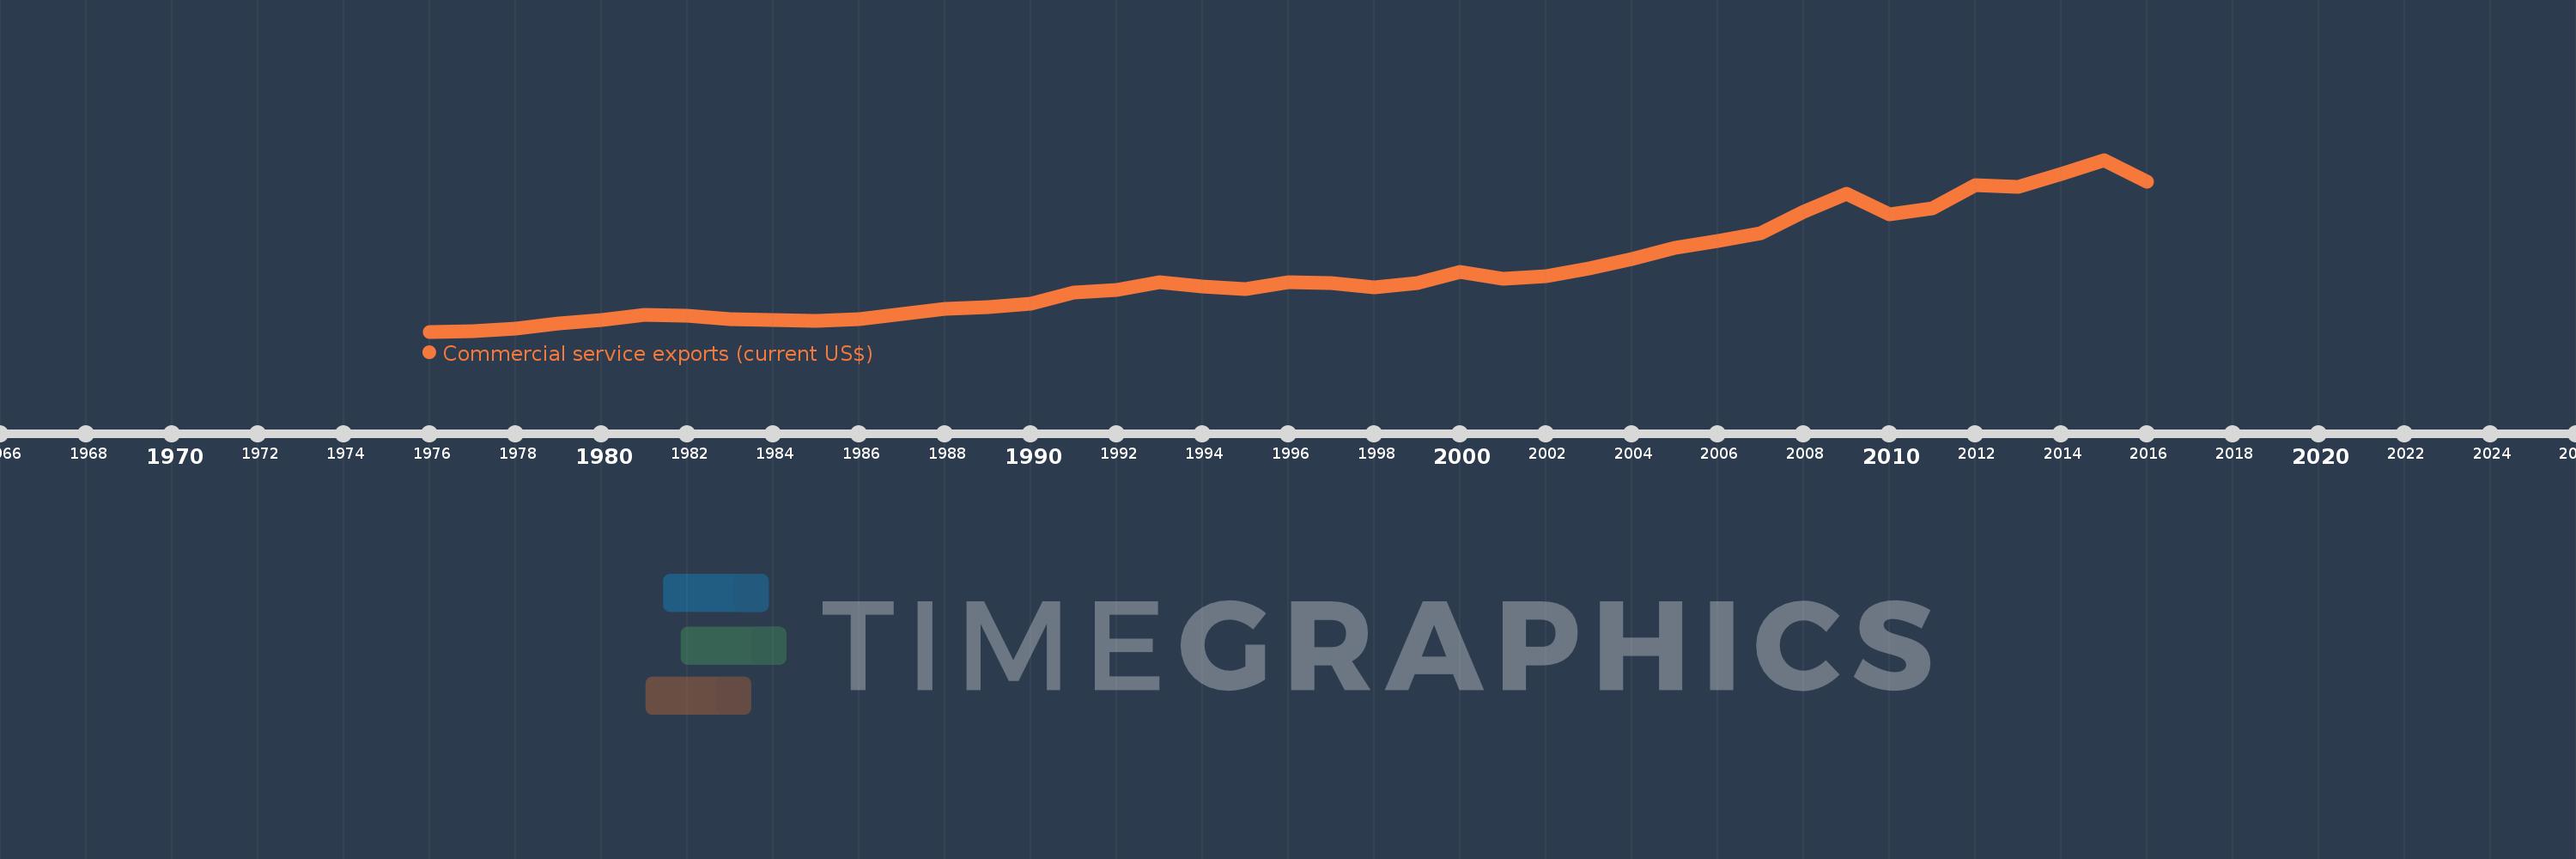
Commercial service exports (current US$)
2016,2015,2014,2013,2012,2011,2010,2009,2008,2007,2006,2005,2004,2003,2002,2001,2000,1999,1998,1997,1996,1995,1994,1993,1992,1991,1990,1989,1988,1987,1986,1985,1984,1983,1982,1981,1980,1979,1978,1977,1976
Diese Statistik in anderen Ländern:
AfghanistanAlbaniaAlgeriaAngolaAntigua and BarbudaArab WorldArgentinaArmeniaArubaAustraliaAustriaAzerbaijanBahamas, TheBahrainBangladeshBarbadosBelarusBelgiumBelizeBeninBermudaBhutanBoliviaBosnia and HerzegovinaBotswanaBrazilBrunei DarussalamBulgariaBurkina FasoBurundiCabo VerdeCambodiaCameroonCanadaCaribbean small statesCentral African RepublicCentral Europe and the BalticsChadChileChinaColombiaComorosCongo, Dem. Rep.Congo, Rep.Costa RicaCote d'IvoireCroatiaCuracaoCyprusCzech RepublicDenmarkDjiboutiDominicaDominican RepublicEarly-demographic dividendEast Asia & PacificEast Asia & Pacific (excluding high income)East Asia & Pacific (IDA & IBRD countries)EcuadorEgypt, Arab Rep.El SalvadorEquatorial GuineaEritreaEstoniaEthiopiaEuro areaEurope & Central AsiaEurope & Central Asia (excluding high income)Europe & Central Asia (IDA & IBRD countries)European UnionFaroe IslandsFijiFinlandFragile and conflict affected situationsFranceFrench PolynesiaGabonGambia, TheGeorgiaGermanyGhanaGreeceGrenadaGuatemalaGuineaGuinea-BissauGuyanaHaitiHeavily indebted poor countries (HIPC)High incomeHondurasHong Kong SAR, ChinaHungaryIBRD onlyIcelandIDA & IBRD totalIDA blendIDA onlyIDA totalIndiaIndonesiaIran, Islamic Rep.IraqIrelandIsraelItalyJamaicaJapanJordanKazakhstanKenyaKiribatiKorea, Rep.KosovoKuwaitKyrgyz RepublicLao PDRLate-demographic dividendLatin America & Caribbean Latin America & Caribbean (excluding high income)Latin America & the Caribbean (IDA & IBRD countries)LatviaLeast developed countries: UN classificationLebanonLesothoLiberiaLibyaLithuaniaLow & middle incomeLow incomeLower middle incomeLuxembourgMacao SAR, ChinaMacedonia, FYRMadagascarMalawiMalaysiaMaldivesMaliMaltaMarshall IslandsMauritaniaMauritiusMexicoMicronesia, Fed. Sts.Middle East & North Africa (excluding high income)Middle East & North Africa (IDA & IBRD countries)Middle incomeMoldovaMongoliaMontenegroMoroccoMozambiqueMyanmarNamibiaNepalNetherlandsNew CaledoniaNew ZealandNicaraguaNigerNigeriaNorth AmericaNorwayOECD membersOmanPacific island small statesPakistanPalauPanamaPapua New GuineaParaguayPeruPhilippinesPolandPortugalPost-demographic dividendPre-demographic dividendQatarRomaniaRussian FederationRwandaSamoaSao Tome and PrincipeSaudi ArabiaSenegalSerbiaSeychellesSierra LeoneSingaporeSint Maarten (Dutch part)Slovak RepublicSloveniaSolomon IslandsSouth AfricaSouth AsiaSouth Asia (IDA & IBRD)South SudanSpainSri LankaSt. Kitts and NevisSt. LuciaSt. Vincent and the GrenadinesSub-Saharan Africa Sub-Saharan Africa (excluding high income)Sub-Saharan Africa (IDA & IBRD countries)SudanSurinameSwazilandSwedenSwitzerlandSyrian Arab RepublicTajikistanTanzaniaThailandTimor-LesteTogoTongaTrinidad and TobagoTunisiaTurkeyTuvaluUgandaUkraineUnited KingdomUnited StatesUpper middle incomeUruguayVanuatuVenezuela, RBVietnamWest Bank and GazaWorldYemen, Rep.ZambiaZimbabwe Zeitlinie:
Diese Zeitleiste vorliegt die Graphik ab 1976 J. bis 2016 J. France. Die Angaben bis 1975 J. sind nicht vorhanden. Die Zahl aktueller Beobachtungen nach Daten: 41.
Die Quelle (Bezeichnung):
Kennzahlen der Weltentwicklung
Die Quelle (Einrichtung):
International Monetary Fund, Balance of Payments Statistics Yearbook and data files.
Kategorien:
Private Sector, Trade
Es wurde aktualisiert:
23 Apr 2017 Jahr
Kennzahlen der Wertänderungen vom Jahr zum Jahr
im Durchschnitt:
106.483 Mlrd.
Minimum:
17.262 Mlrd.
1 Jan 1976 Jahr
Maximum:
273.734 Mlrd.
1 Jan 2015 Jahr
Zum Datum der Beobachtung
Wert
Absolute Veränderung
Die Veränderung bezüglich dem vorherigen Wert
1 Jan 1976 Jahr
17.262 Mlrd.
+17.262 Mlrd.
0.0%
1 Jan 1977 Jahr
18.231 Mlrd.
+968.378 Mln.
5.61%
1 Jan 1978 Jahr
22.257 Mlrd.
+4.026 Mlrd.
22.08%
1 Jan 1979 Jahr
29.219 Mlrd.
+6.962 Mlrd.
31.28%
1 Jan 1980 Jahr
35.005 Mlrd.
+5.786 Mlrd.
19.8%
1 Jan 1981 Jahr
42.381 Mlrd.
+7.376 Mlrd.
21.07%
1 Jan 1982 Jahr
41.086 Mlrd.
-1.296 Mlrd.
-3.06%
1 Jan 1983 Jahr
35.673 Mlrd.
-5.413 Mlrd.
-13.18%
1 Jan 1984 Jahr
34.464 Mlrd.
-1.209 Mlrd.
-3.39%
1 Jan 1985 Jahr
33.9 Mlrd.
-563.812 Mln.
-1.64%
1 Jan 1986 Jahr
35.702 Mlrd.
+1.802 Mlrd.
5.32%
1 Jan 1987 Jahr
43.685 Mlrd.
+7.983 Mlrd.
22.36%
1 Jan 1988 Jahr
50.911 Mlrd.
+7.226 Mlrd.
16.54%
1 Jan 1989 Jahr
53.981 Mlrd.
+3.07 Mlrd.
6.03%
1 Jan 1990 Jahr
59.138 Mlrd.
+5.157 Mlrd.
9.55%
1 Jan 1991 Jahr
76.161 Mlrd.
+17.022 Mlrd.
28.78%
1 Jan 1992 Jahr
79.151 Mlrd.
+2.991 Mlrd.
3.93%
1 Jan 1993 Jahr
90.682 Mlrd.
+11.531 Mlrd.
14.57%
1 Jan 1994 Jahr
84.668 Mlrd.
-6.015 Mlrd.
-6.63%
1 Jan 1995 Jahr
80.989 Mlrd.
-3.679 Mlrd.
-4.34%
1 Jan 1996 Jahr
91.14 Mlrd.
+10.151 Mlrd.
12.53%
1 Jan 1997 Jahr
90.105 Mlrd.
-1.034 Mlrd.
-1.13%
1 Jan 1998 Jahr
83.905 Mlrd.
-6.2 Mlrd.
-6.88%
1 Jan 1999 Jahr
89.251 Mlrd.
+5.346 Mlrd.
6.37%
1 Jan 2000 Jahr
105.812 Mlrd.
+16.561 Mlrd.
18.56%
1 Jan 2001 Jahr
96.16 Mlrd.
-9.652 Mlrd.
-9.12%
1 Jan 2002 Jahr
99.897 Mlrd.
+3.737 Mlrd.
3.89%
1 Jan 2003 Jahr
112.03 Mlrd.
+12.133 Mlrd.
12.15%
1 Jan 2004 Jahr
125.209 Mlrd.
+13.179 Mlrd.
11.76%
1 Jan 2005 Jahr
141.893 Mlrd.
+16.684 Mlrd.
13.33%
1 Jan 2006 Jahr
152.417 Mlrd.
+10.523 Mlrd.
7.42%
1 Jan 2007 Jahr
164.531 Mlrd.
+12.114 Mlrd.
7.95%
1 Jan 2008 Jahr
195.776 Mlrd.
+31.244 Mlrd.
18.99%
1 Jan 2009 Jahr
223.125 Mlrd.
+27.349 Mlrd.
13.97%
1 Jan 2010 Jahr
192.818 Mlrd.
-30.307 Mlrd.
-13.58%
1 Jan 2011 Jahr
200.697 Mlrd.
+7.879 Mlrd.
4.09%
1 Jan 2012 Jahr
235.485 Mlrd.
+34.788 Mlrd.
17.33%
1 Jan 2013 Jahr
233.455 Mlrd.
-2.03 Mlrd.
-0.86%
1 Jan 2014 Jahr
253.122 Mlrd.
+19.667 Mlrd.
8.42%
1 Jan 2015 Jahr
273.734 Mlrd.
+20.612 Mlrd.
8.14%
1 Jan 2016 Jahr
240.709 Mlrd.
-33.026 Mlrd.
-12.06%
Bewertung der Länder gemäß mit laufender Statistik nach Jahren


Kommentare: