29
/de/
de
AIzaSyAYiBZKx7MnpbEhh9jyipgxe19OcubqV5w
April 1, 2024
191224
Malta
MLT
true
2
1
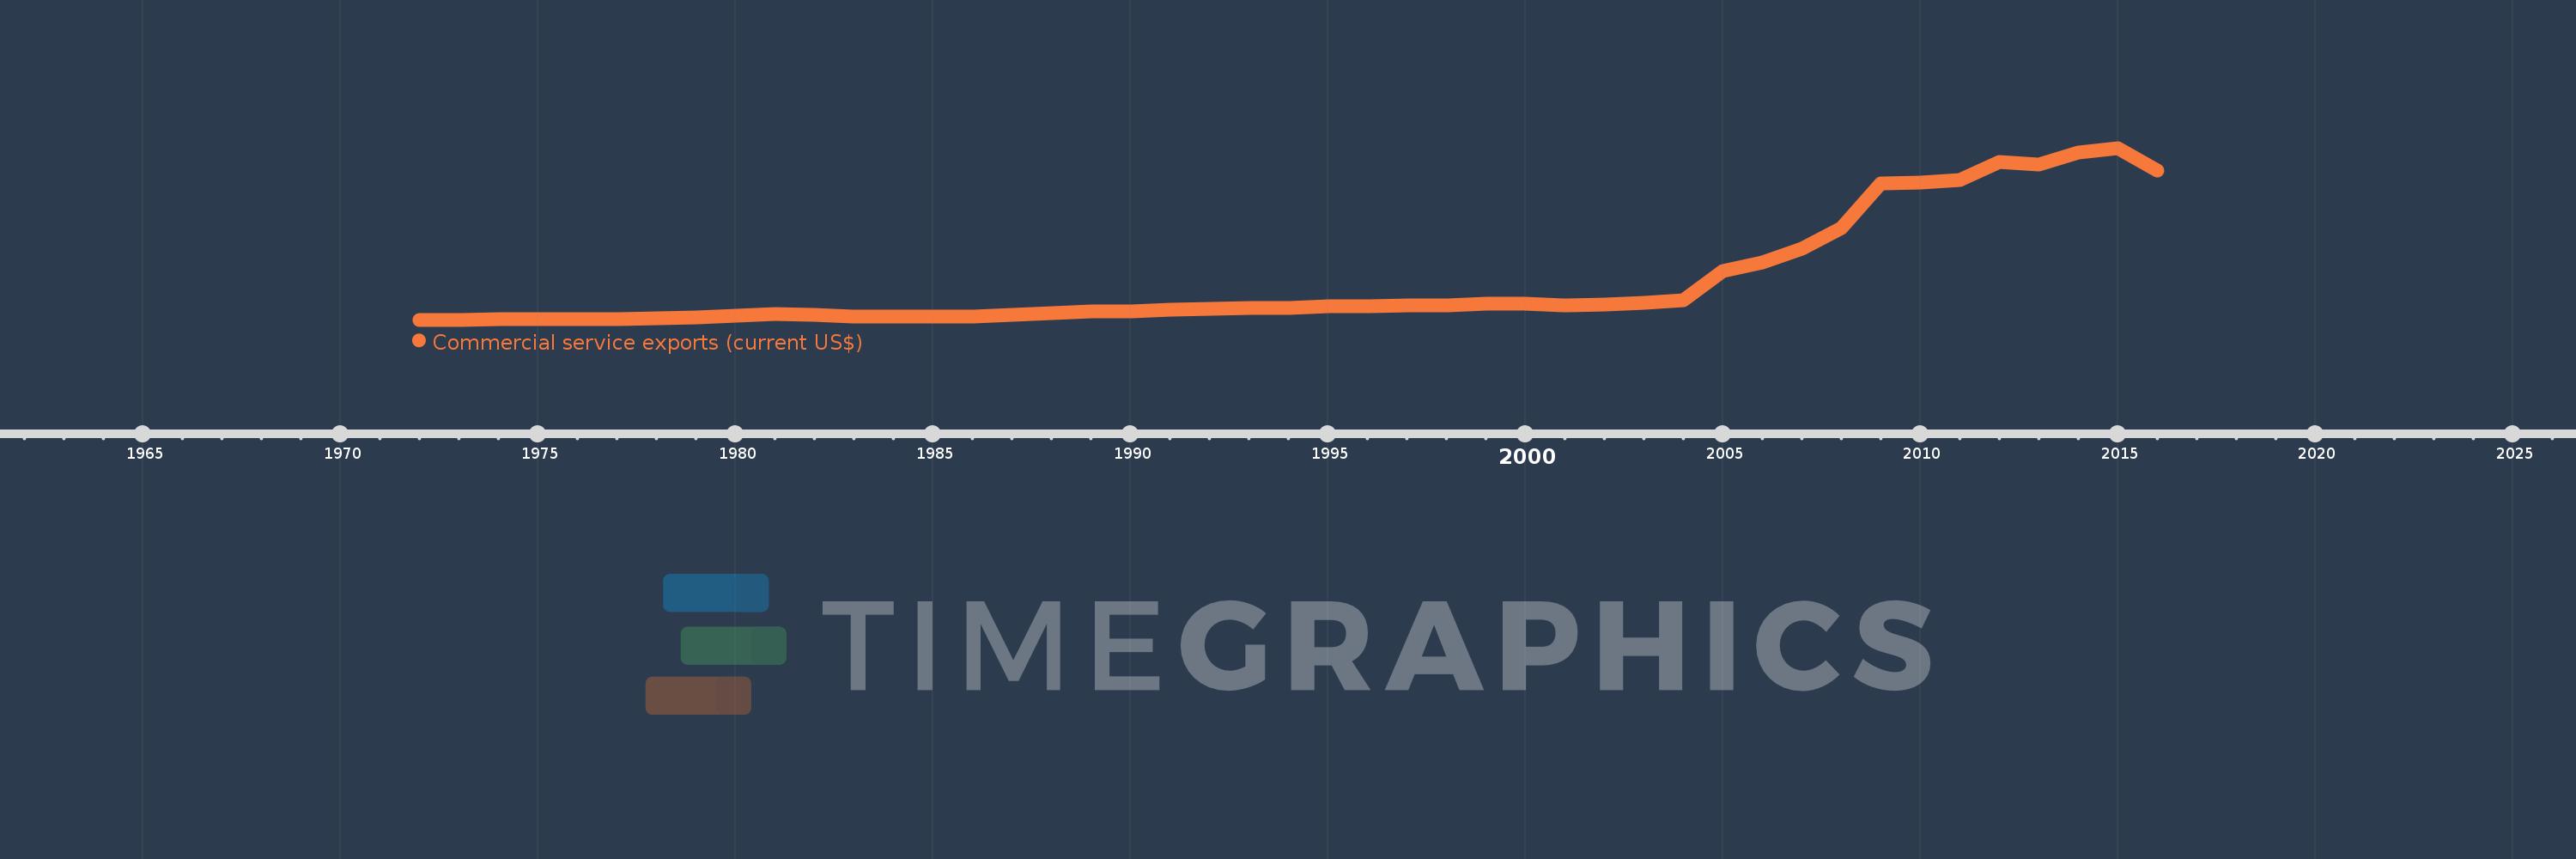
Commercial service exports (current US$)
2016,2015,2014,2013,2012,2011,2010,2009,2008,2007,2006,2005,2004,2003,2002,2001,2000,1999,1998,1997,1996,1995,1994,1993,1992,1991,1990,1989,1988,1987,1986,1985,1984,1983,1982,1981,1980,1979,1978,1977,1976,1975,1974,1973,1972
Diese Statistik in anderen Ländern:
AfghanistanAlbaniaAlgeriaAngolaAntigua and BarbudaArab WorldArgentinaArmeniaArubaAustraliaAustriaAzerbaijanBahamas, TheBahrainBangladeshBarbadosBelarusBelgiumBelizeBeninBermudaBhutanBoliviaBosnia and HerzegovinaBotswanaBrazilBrunei DarussalamBulgariaBurkina FasoBurundiCabo VerdeCambodiaCameroonCanadaCaribbean small statesCentral African RepublicCentral Europe and the BalticsChadChileChinaColombiaComorosCongo, Dem. Rep.Congo, Rep.Costa RicaCote d'IvoireCroatiaCuracaoCyprusCzech RepublicDenmarkDjiboutiDominicaDominican RepublicEarly-demographic dividendEast Asia & PacificEast Asia & Pacific (excluding high income)East Asia & Pacific (IDA & IBRD countries)EcuadorEgypt, Arab Rep.El SalvadorEquatorial GuineaEritreaEstoniaEthiopiaEuro areaEurope & Central AsiaEurope & Central Asia (excluding high income)Europe & Central Asia (IDA & IBRD countries)European UnionFaroe IslandsFijiFinlandFragile and conflict affected situationsFranceFrench PolynesiaGabonGambia, TheGeorgiaGermanyGhanaGreeceGrenadaGuatemalaGuineaGuinea-BissauGuyanaHaitiHeavily indebted poor countries (HIPC)High incomeHondurasHong Kong SAR, ChinaHungaryIBRD onlyIcelandIDA & IBRD totalIDA blendIDA onlyIDA totalIndiaIndonesiaIran, Islamic Rep.IraqIrelandIsraelItalyJamaicaJapanJordanKazakhstanKenyaKiribatiKorea, Rep.KosovoKuwaitKyrgyz RepublicLao PDRLate-demographic dividendLatin America & Caribbean Latin America & Caribbean (excluding high income)Latin America & the Caribbean (IDA & IBRD countries)LatviaLeast developed countries: UN classificationLebanonLesothoLiberiaLibyaLithuaniaLow & middle incomeLow incomeLower middle incomeLuxembourgMacao SAR, ChinaMacedonia, FYRMadagascarMalawiMalaysiaMaldivesMaliMaltaMarshall IslandsMauritaniaMauritiusMexicoMicronesia, Fed. Sts.Middle East & North Africa (excluding high income)Middle East & North Africa (IDA & IBRD countries)Middle incomeMoldovaMongoliaMontenegroMoroccoMozambiqueMyanmarNamibiaNepalNetherlandsNew CaledoniaNew ZealandNicaraguaNigerNigeriaNorth AmericaNorwayOECD membersOmanPacific island small statesPakistanPalauPanamaPapua New GuineaParaguayPeruPhilippinesPolandPortugalPost-demographic dividendPre-demographic dividendQatarRomaniaRussian FederationRwandaSamoaSao Tome and PrincipeSaudi ArabiaSenegalSerbiaSeychellesSierra LeoneSingaporeSint Maarten (Dutch part)Slovak RepublicSloveniaSolomon IslandsSouth AfricaSouth AsiaSouth Asia (IDA & IBRD)South SudanSpainSri LankaSt. Kitts and NevisSt. LuciaSt. Vincent and the GrenadinesSub-Saharan Africa Sub-Saharan Africa (excluding high income)Sub-Saharan Africa (IDA & IBRD countries)SudanSurinameSwazilandSwedenSwitzerlandSyrian Arab RepublicTajikistanTanzaniaThailandTimor-LesteTogoTongaTrinidad and TobagoTunisiaTurkeyTuvaluUgandaUkraineUnited KingdomUnited StatesUpper middle incomeUruguayVanuatuVenezuela, RBVietnamWest Bank and GazaWorldYemen, Rep.ZambiaZimbabwe Zeitlinie:
Diese Zeitleiste vorliegt die Graphik ab 1972 J. bis 2016 J. Malta. Die Angaben bis 1971 J. sind nicht vorhanden. Die Zahl aktueller Beobachtungen nach Daten: 45.
Die Quelle (Bezeichnung):
Kennzahlen der Weltentwicklung
Die Quelle (Einrichtung):
International Monetary Fund, Balance of Payments Statistics Yearbook and data files.
Kategorien:
Private Sector, Trade
Es wurde aktualisiert:
23 Apr 2017 Jahr
Kennzahlen der Wertänderungen vom Jahr zum Jahr
im Durchschnitt:
2.801 Mlrd.
Minimum:
33.283 Mln.
1 Jan 1973 Jahr
Maximum:
12.323 Mlrd.
1 Jan 2015 Jahr
Zum Datum der Beobachtung
Wert
Absolute Veränderung
Die Veränderung bezüglich dem vorherigen Wert
1 Jan 1972 Jahr
37.828 Mln.
+37.828 Mln.
0.0%
1 Jan 1973 Jahr
33.283 Mln.
-4.545 Mln.
-12.01%
1 Jan 1974 Jahr
55.044 Mln.
+21.761 Mln.
65.38%
1 Jan 1975 Jahr
75.231 Mln.
+20.187 Mln.
36.67%
1 Jan 1976 Jahr
103.175 Mln.
+27.944 Mln.
37.15%
1 Jan 1977 Jahr
102.32 Mln.
-854.708 Tsnd.
-0.83%
1 Jan 1978 Jahr
125.5 Mln.
+23.18 Mln.
22.65%
1 Jan 1979 Jahr
187.605 Mln.
+62.105 Mln.
49.49%
1 Jan 1980 Jahr
302.396 Mln.
+114.791 Mln.
61.19%
1 Jan 1981 Jahr
441.194 Mln.
+138.797 Mln.
45.9%
1 Jan 1982 Jahr
394.103 Mln.
-47.09 Mln.
-10.67%
1 Jan 1983 Jahr
290.919 Mln.
-103.184 Mln.
-26.18%
1 Jan 1984 Jahr
269.165 Mln.
-21.754 Mln.
-7.48%
1 Jan 1985 Jahr
237.726 Mln.
-31.438 Mln.
-11.68%
1 Jan 1986 Jahr
260.042 Mln.
+22.316 Mln.
9.39%
1 Jan 1987 Jahr
357.259 Mln.
+97.217 Mln.
37.39%
1 Jan 1988 Jahr
536.916 Mln.
+179.657 Mln.
50.29%
1 Jan 1989 Jahr
639.854 Mln.
+102.938 Mln.
19.17%
1 Jan 1990 Jahr
627.56 Mln.
-12.294 Mln.
-1.92%
1 Jan 1991 Jahr
727.534 Mln.
+99.974 Mln.
15.93%
1 Jan 1992 Jahr
787.644 Mln.
+60.11 Mln.
8.26%
1 Jan 1993 Jahr
867.905 Mln.
+80.261 Mln.
10.19%
1 Jan 1994 Jahr
899.518 Mln.
+31.613 Mln.
3.64%
1 Jan 1995 Jahr
979.757 Mln.
+80.24 Mln.
8.92%
1 Jan 1996 Jahr
1.028 Mlrd.
+47.791 Mln.
4.88%
1 Jan 1997 Jahr
1.041 Mlrd.
+13.77 Mln.
1.34%
1 Jan 1998 Jahr
1.069 Mlrd.
+27.714 Mln.
2.66%
1 Jan 1999 Jahr
1.153 Mlrd.
+83.909 Mln.
7.85%
1 Jan 2000 Jahr
1.193 Mlrd.
+39.647 Mln.
3.44%
1 Jan 2001 Jahr
1.076 Mlrd.
-116.937 Mln.
-9.81%
1 Jan 2002 Jahr
1.101 Mlrd.
+25.625 Mln.
2.38%
1 Jan 2003 Jahr
1.215 Mlrd.
+114.027 Mln.
10.35%
1 Jan 2004 Jahr
1.413 Mlrd.
+197.894 Mln.
16.28%
1 Jan 2005 Jahr
3.5 Mlrd.
+2.087 Mlrd.
147.69%
1 Jan 2006 Jahr
4.125 Mlrd.
+624.22 Mln.
17.83%
1 Jan 2007 Jahr
5.124 Mlrd.
+999.165 Mln.
24.22%
1 Jan 2008 Jahr
6.594 Mlrd.
+1.471 Mlrd.
28.7%
1 Jan 2009 Jahr
9.79 Mlrd.
+3.196 Mlrd.
48.46%
1 Jan 2010 Jahr
9.831 Mlrd.
+40.661 Mln.
0.42%
1 Jan 2011 Jahr
10.025 Mlrd.
+194.056 Mln.
1.97%
1 Jan 2012 Jahr
11.317 Mlrd.
+1.292 Mlrd.
12.89%
1 Jan 2013 Jahr
11.123 Mlrd.
-194.074 Mln.
-1.71%
1 Jan 2014 Jahr
11.968 Mlrd.
+845.19 Mln.
7.6%
1 Jan 2015 Jahr
12.323 Mlrd.
+354.575 Mln.
2.96%
1 Jan 2016 Jahr
10.683 Mlrd.
-1.64 Mlrd.
-13.31%
Bewertung der Länder gemäß mit laufender Statistik nach Jahren


Kommentare: