29
/de/
de
AIzaSyAYiBZKx7MnpbEhh9jyipgxe19OcubqV5w
April 1, 2024
50353
Middle East & North Africa (IDA & IBRD countries)
TMN
false
2
1
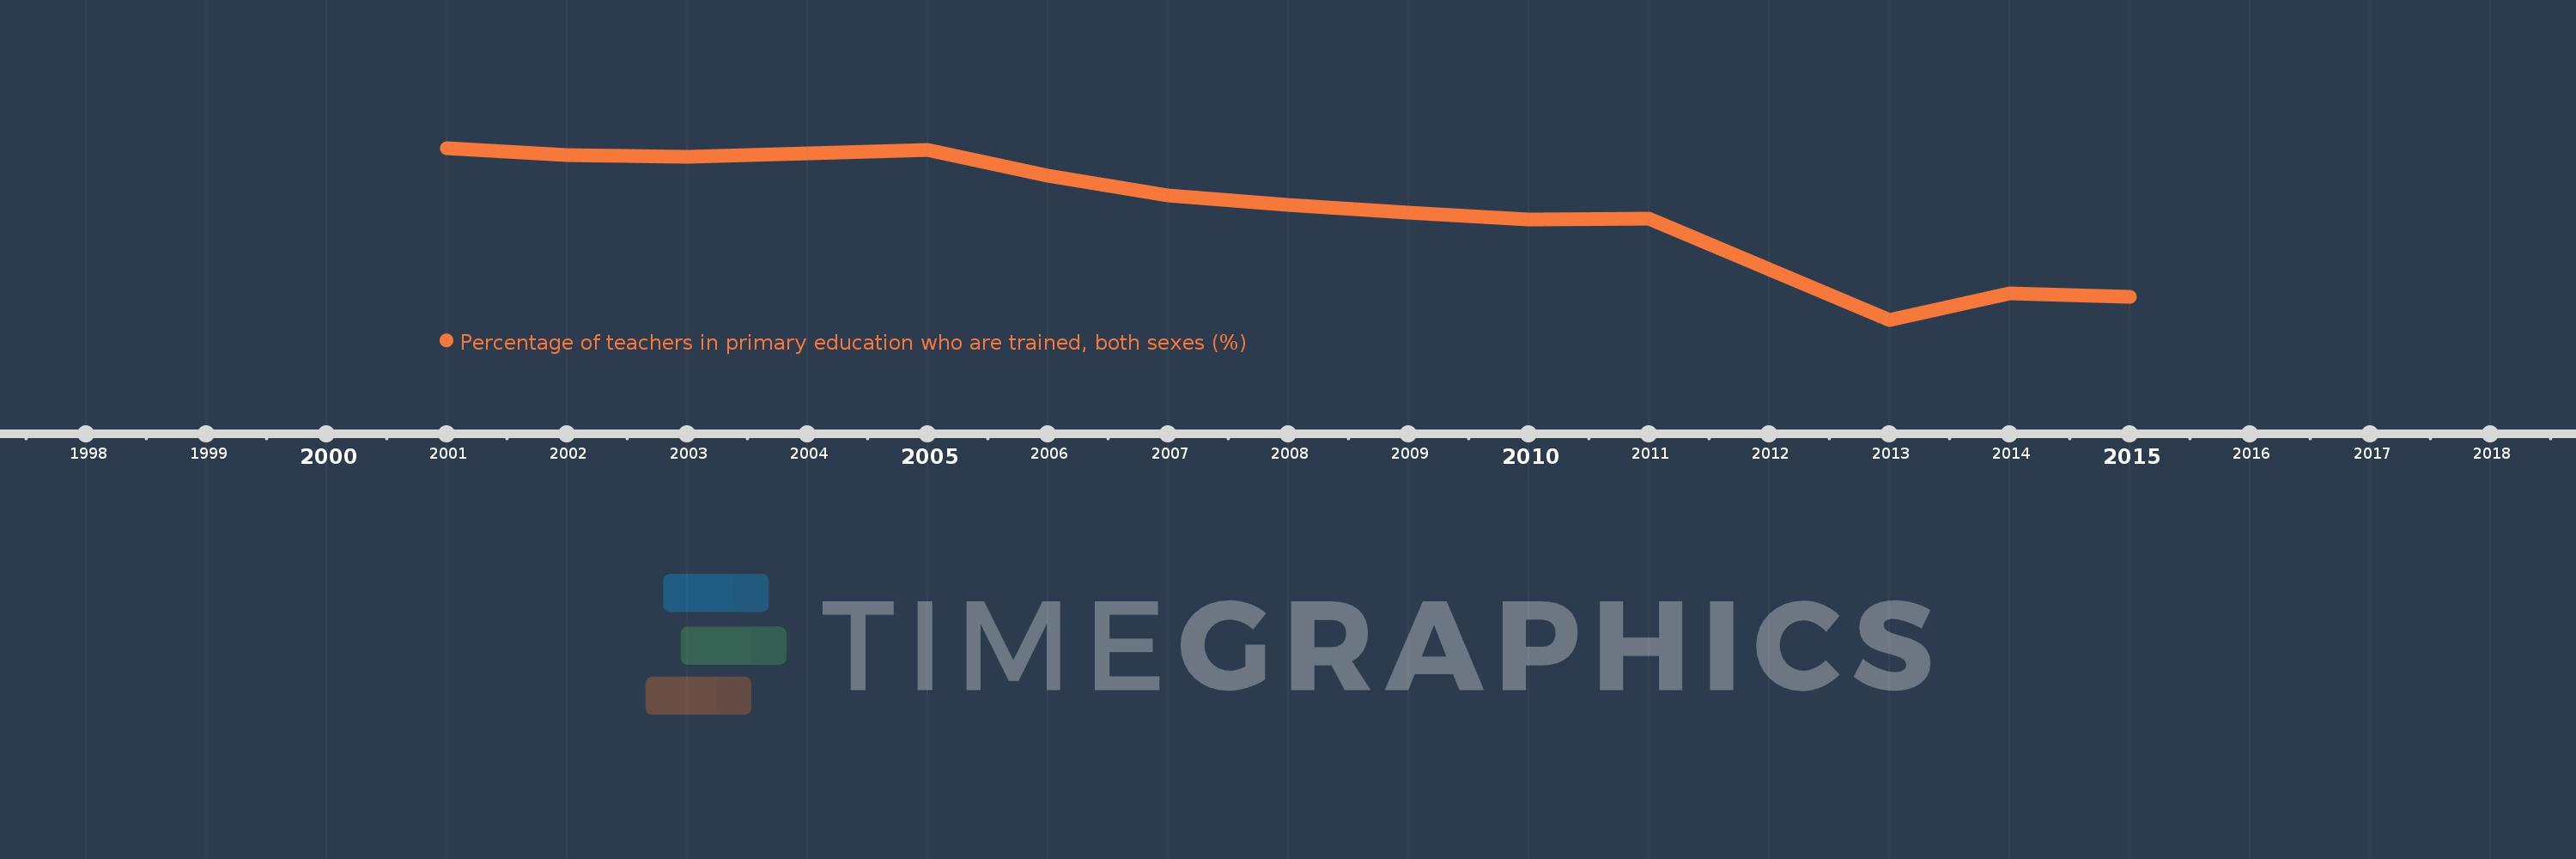
Percentage of teachers in primary education who are trained, both sexes (%)
2015,2014,2013,2011,2010,2009,2008,2007,2006,2005,2004,2003,2002,2001
Diese Statistik in anderen Ländern:
Zeitlinie:
Diese Zeitleiste vorliegt die Graphik ab 2001 J. bis 2015 J. Middle East & North Africa (IDA & IBRD countries). Die Angaben bis 2000 J. sind nicht vorhanden. Die Zahl aktueller Beobachtungen nach Daten: 14.
Die Quelle (Bezeichnung):
Kennzahlen der Weltentwicklung
Die Quelle (Einrichtung):
United Nations Educational, Scientific, and Cultural Organization (UNESCO) Institute for Statistics.
Kategorien:
Education
Es wurde aktualisiert:
23 Apr 2017 Jahr
Kennzahlen der Wertänderungen vom Jahr zum Jahr
Minimum:
81.988
1 Jan 2013 Jahr
Maximum:
97.394
1 Jan 2001 Jahr
Zum Datum der Beobachtung
Wert
Absolute Veränderung
Die Veränderung bezüglich dem vorherigen Wert
1 Jan 2001 Jahr
97.394
+97.394
0.0%
1 Jan 2002 Jahr
96.739
-0.655
-0.67%
1 Jan 2003 Jahr
96.621
-0.118
-0.12%
1 Jan 2004 Jahr
96.931
+0.31
0.32%
1 Jan 2005 Jahr
97.254
+0.323
0.33%
1 Jan 2006 Jahr
94.899
-2.355
-2.42%
1 Jan 2007 Jahr
93.117
-1.782
-1.88%
1 Jan 2008 Jahr
92.301
-0.816
-0.88%
1 Jan 2009 Jahr
91.592
-0.709
-0.77%
1 Jan 2010 Jahr
91.005
-0.587
-0.64%
1 Jan 2011 Jahr
91.051
+0.046
0.05%
1 Jan 2013 Jahr
81.988
-9.062
-9.95%
1 Jan 2014 Jahr
84.351
+2.362
2.88%
1 Jan 2015 Jahr
84.082
-0.269
-0.32%
Bewertung der Länder gemäß mit laufender Statistik nach Jahren


Kommentare: