29
/de/
de
AIzaSyAYiBZKx7MnpbEhh9jyipgxe19OcubqV5w
April 1, 2024
188260
Malaysia
MYS
true
2
1
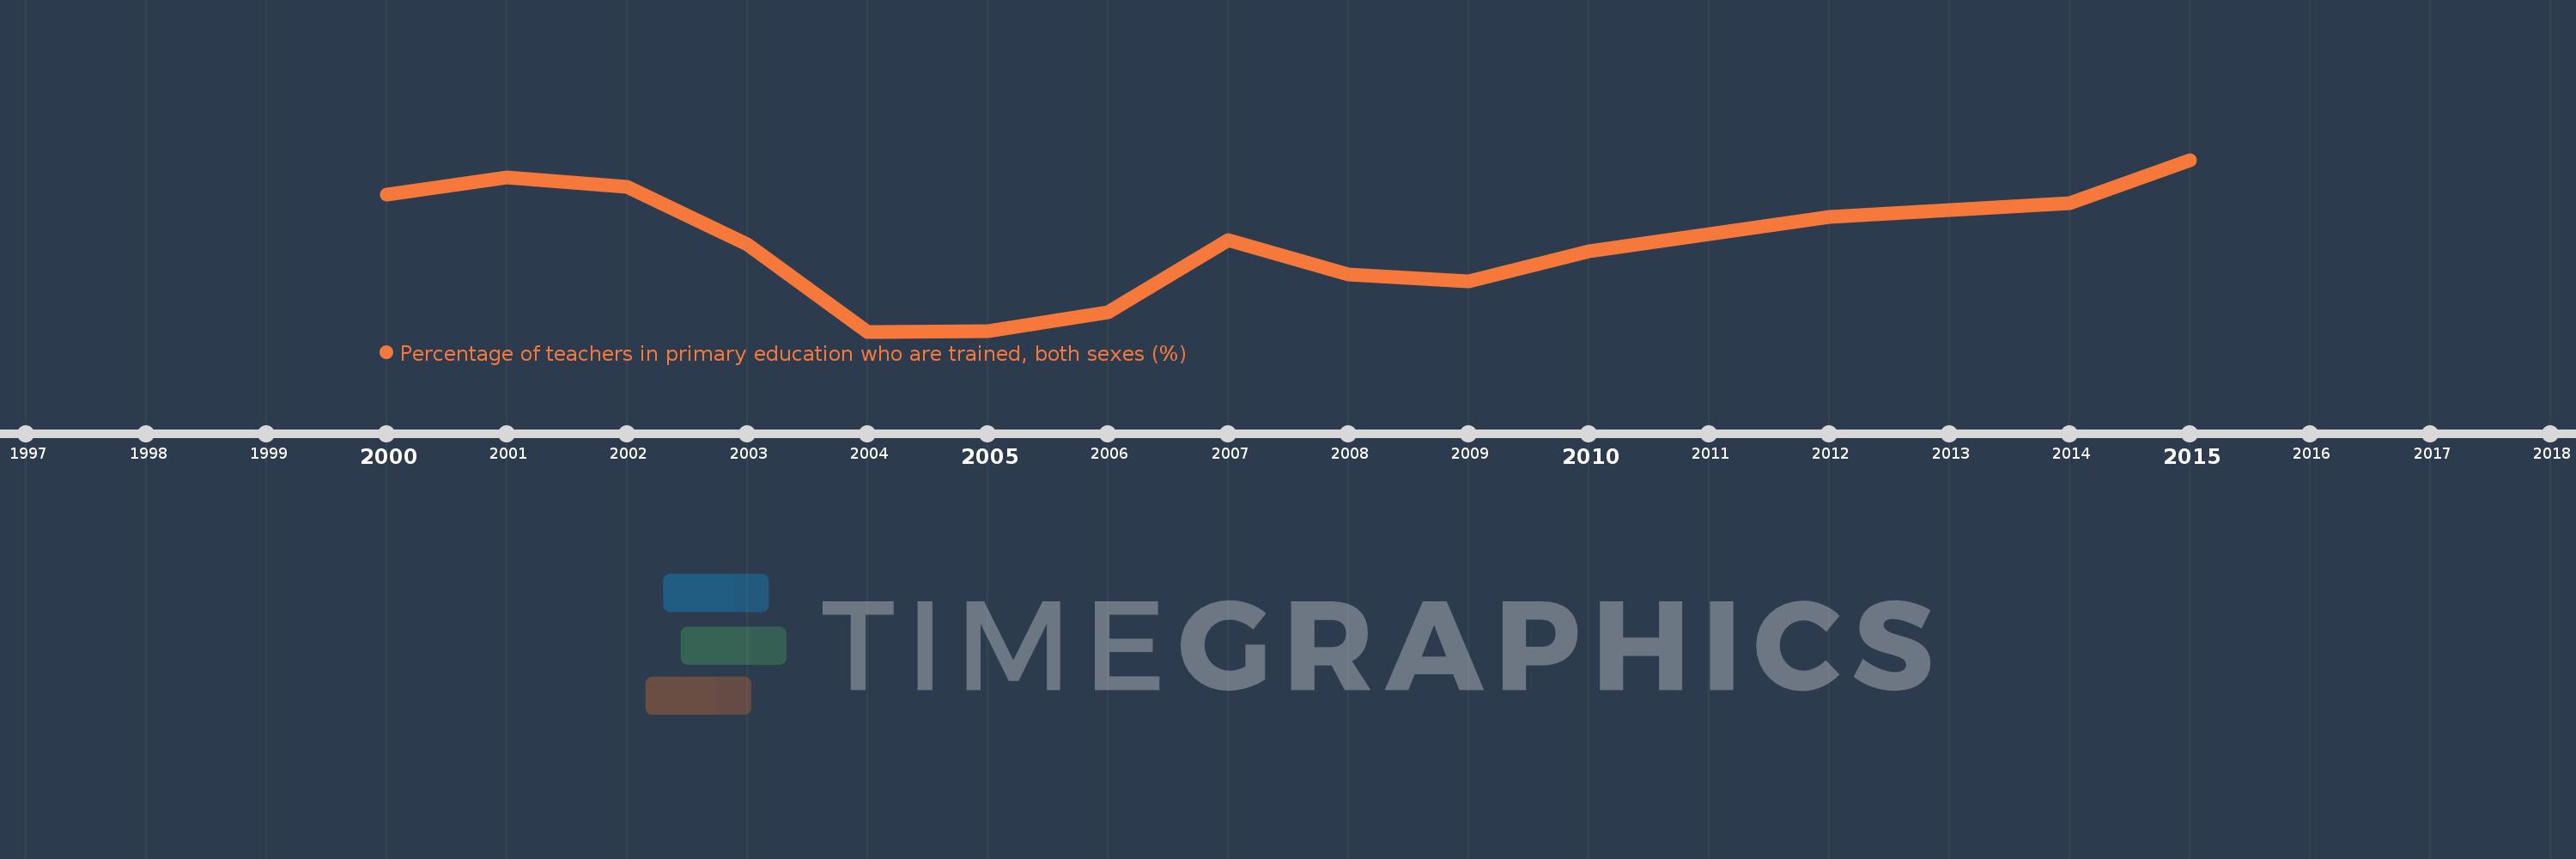
Percentage of teachers in primary education who are trained, both sexes (%)
2015,2014,2013,2012,2011,2010,2009,2008,2007,2006,2005,2004,2003,2002,2001,2000
Diese Statistik in anderen Ländern:
Zeitlinie:
Diese Zeitleiste vorliegt die Graphik ab 2000 J. bis 2015 J. Malaysia. Die Angaben bis 1999 J. sind nicht vorhanden. Die Zahl aktueller Beobachtungen nach Daten: 16.
Die Quelle (Bezeichnung):
Kennzahlen der Weltentwicklung
Die Quelle (Einrichtung):
United Nations Educational, Scientific, and Cultural Organization (UNESCO) Institute for Statistics.
Kategorien:
Education
Es wurde aktualisiert:
23 Apr 2017 Jahr
Kennzahlen der Wertänderungen vom Jahr zum Jahr
Minimum:
91.026
1 Jan 2004 Jahr
Maximum:
98.648
1 Jan 2015 Jahr
Zum Datum der Beobachtung
Wert
Absolute Veränderung
Die Veränderung bezüglich dem vorherigen Wert
1 Jan 2000 Jahr
97.107
+97.107
0.0%
1 Jan 2001 Jahr
97.852
+0.745
0.77%
1 Jan 2002 Jahr
97.458
-0.393
-0.4%
1 Jan 2003 Jahr
94.913
-2.546
-2.61%
1 Jan 2004 Jahr
91.026
-3.887
-4.09%
1 Jan 2005 Jahr
91.048
+0.022
0.02%
1 Jan 2006 Jahr
91.886
+0.838
0.92%
1 Jan 2007 Jahr
95.084
+3.198
3.48%
1 Jan 2008 Jahr
93.555
-1.529
-1.61%
1 Jan 2009 Jahr
93.26
-0.295
-0.32%
1 Jan 2010 Jahr
94.593
+1.333
1.43%
1 Jan 2011 Jahr
95.356
+0.763
0.81%
1 Jan 2012 Jahr
96.121
+0.765
0.8%
1 Jan 2013 Jahr
96.433
+0.312
0.32%
1 Jan 2014 Jahr
96.713
+0.281
0.29%
1 Jan 2015 Jahr
98.648
+1.934
2.0%
Bewertung der Länder gemäß mit laufender Statistik nach Jahren


Kommentare: