29
/de/
de
AIzaSyAYiBZKx7MnpbEhh9jyipgxe19OcubqV5w
April 1, 2024
112732
Costa Rica
CRI
true
2
1
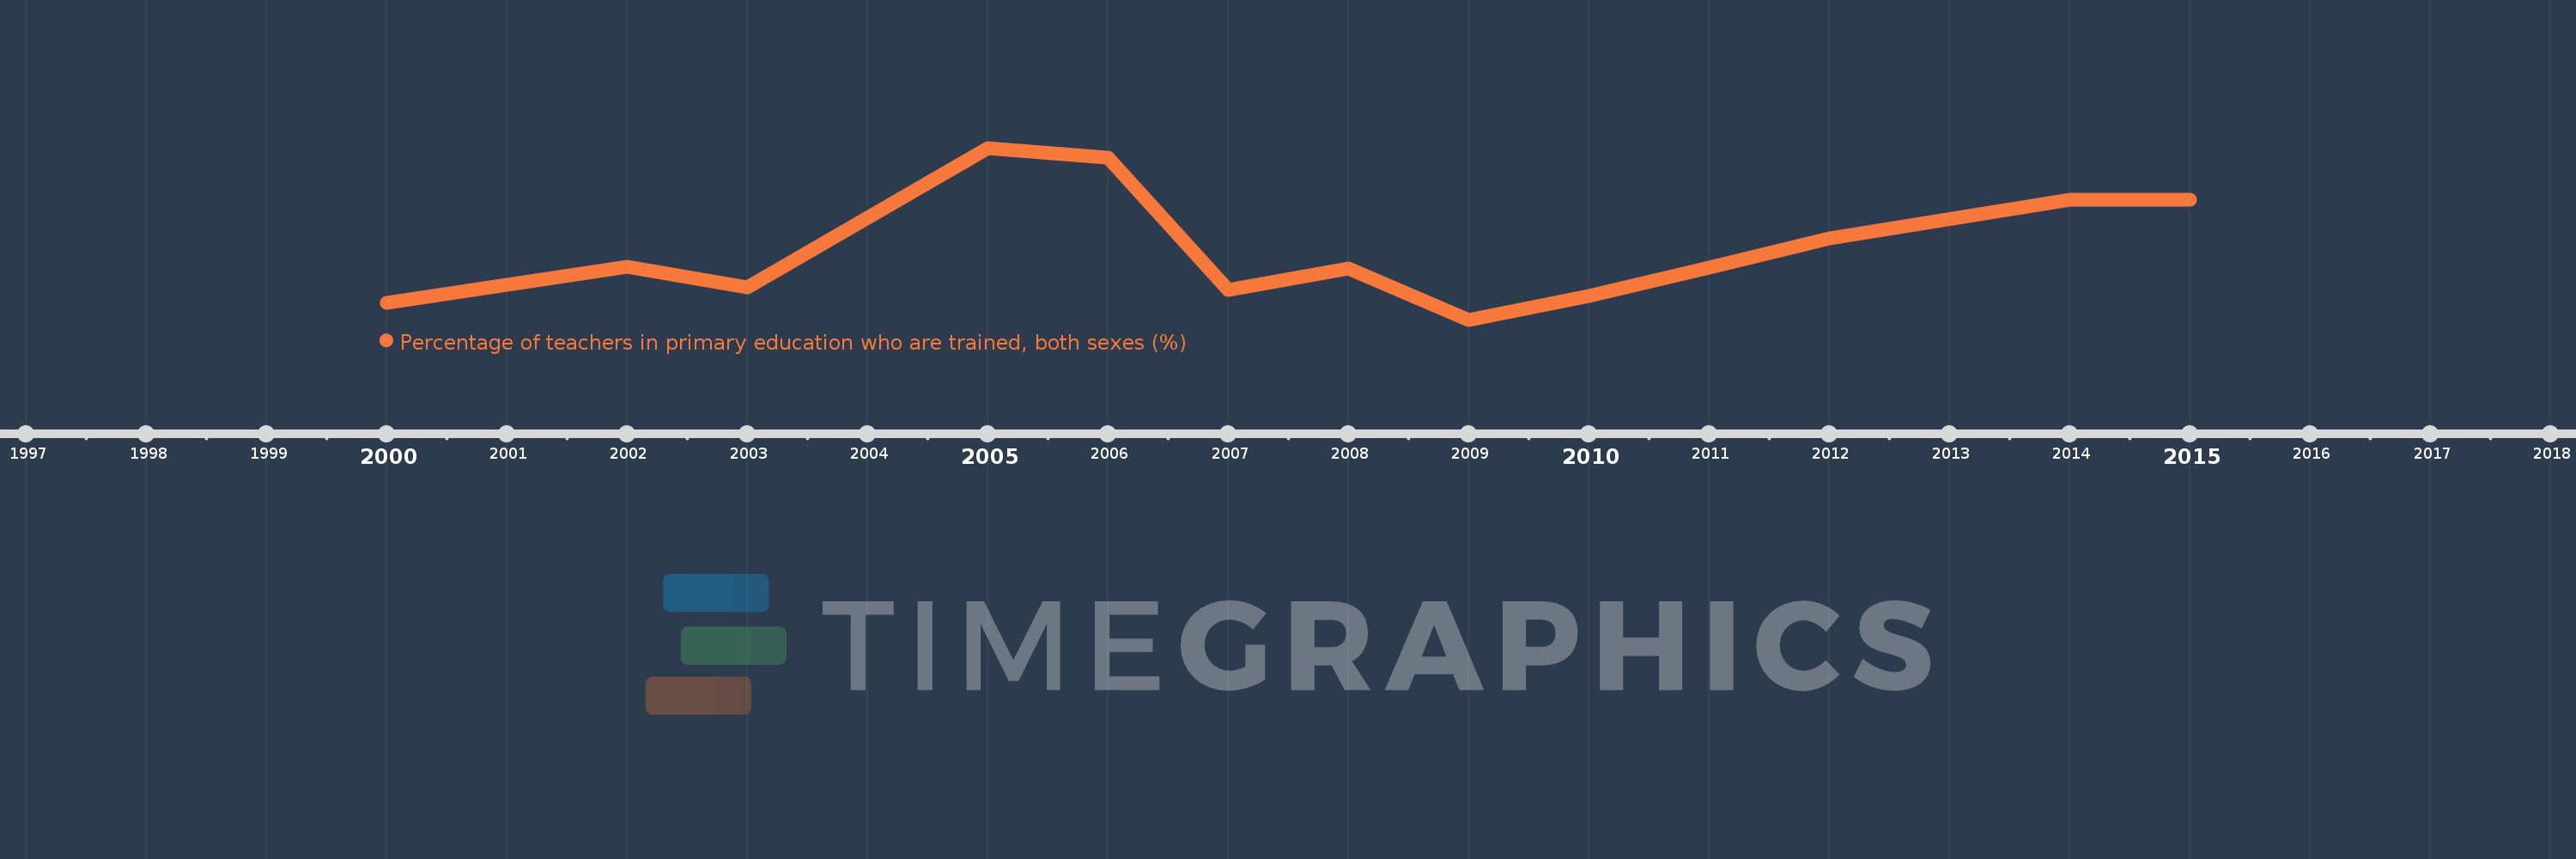
Percentage of teachers in primary education who are trained, both sexes (%)
2015,2014,2012,2011,2010,2009,2008,2007,2006,2005,2003,2002,2000
Diese Statistik in anderen Ländern:
Zeitlinie:
Diese Zeitleiste vorliegt die Graphik ab 2000 J. bis 2015 J. Costa Rica. Die Angaben bis 1999 J. sind nicht vorhanden. Die Zahl aktueller Beobachtungen nach Daten: 13.
Die Quelle (Bezeichnung):
Kennzahlen der Weltentwicklung
Die Quelle (Einrichtung):
United Nations Educational, Scientific, and Cultural Organization (UNESCO) Institute for Statistics.
Kategorien:
Education
Es wurde aktualisiert:
23 Apr 2017 Jahr
Kennzahlen der Wertänderungen vom Jahr zum Jahr
Minimum:
86.046
1 Jan 2009 Jahr
Maximum:
97.425
1 Jan 2005 Jahr
Zum Datum der Beobachtung
Wert
Absolute Veränderung
Die Veränderung bezüglich dem vorherigen Wert
1 Jan 2000 Jahr
87.176
+87.176
0.0%
1 Jan 2002 Jahr
89.544
+2.369
2.72%
1 Jan 2003 Jahr
88.207
-1.337
-1.49%
1 Jan 2005 Jahr
97.425
+9.218
10.45%
1 Jan 2006 Jahr
96.787
-0.638
-0.66%
1 Jan 2007 Jahr
88.043
-8.744
-9.03%
1 Jan 2008 Jahr
89.465
+1.422
1.62%
1 Jan 2009 Jahr
86.046
-3.419
-3.82%
1 Jan 2010 Jahr
87.6
+1.554
1.81%
1 Jan 2011 Jahr
89.483
+1.883
2.15%
1 Jan 2012 Jahr
91.448
+1.965
2.2%
1 Jan 2014 Jahr
93.975
+2.527
2.76%
1 Jan 2015 Jahr
93.981
+0.005
0.01%
Bewertung der Länder gemäß mit laufender Statistik nach Jahren


Kommentare: