29
/de/
de
AIzaSyAYiBZKx7MnpbEhh9jyipgxe19OcubqV5w
April 1, 2024
48446
Middle East & North Africa
MEA
false
2
1
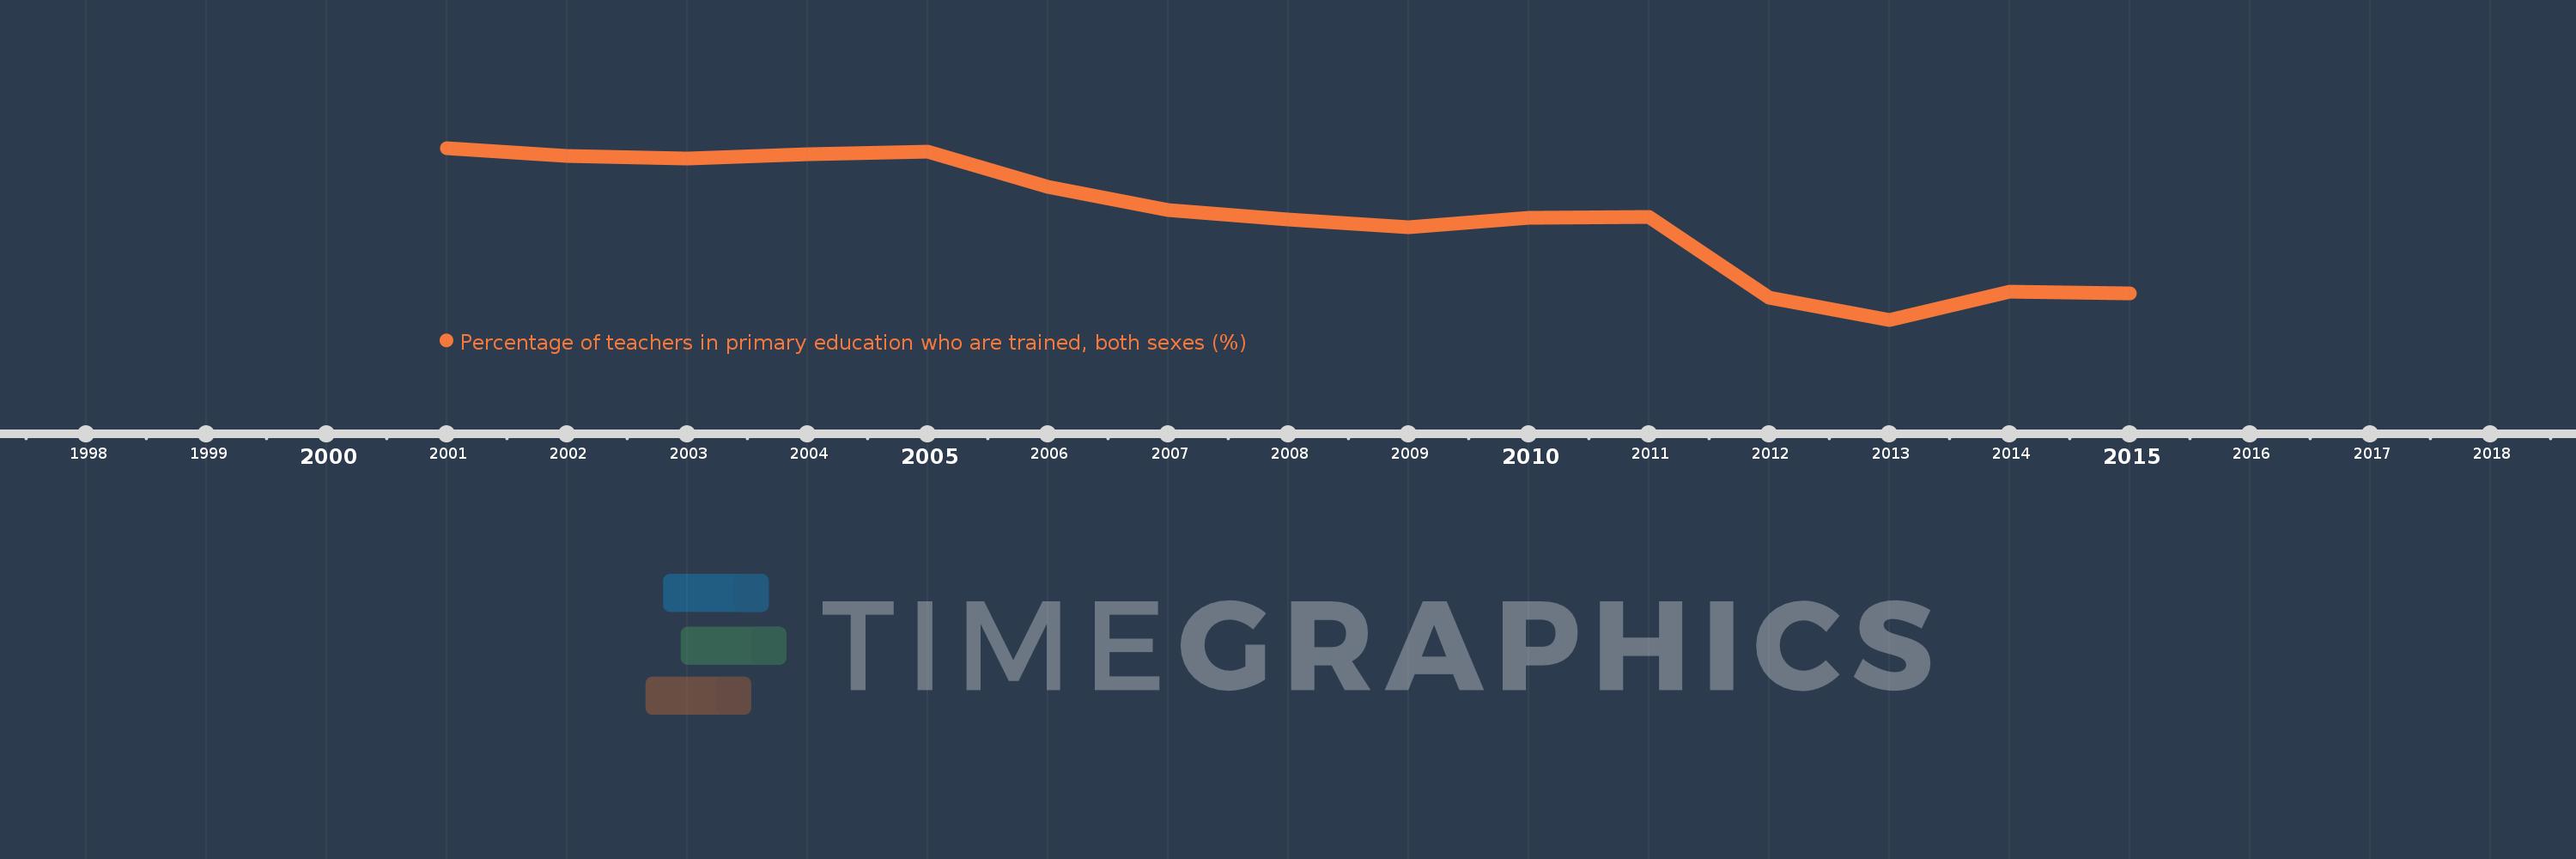
Percentage of teachers in primary education who are trained, both sexes (%)
2015,2014,2013,2012,2011,2010,2009,2008,2007,2006,2005,2004,2003,2002,2001
Diese Statistik in anderen Ländern:
Zeitlinie:
Diese Zeitleiste vorliegt die Graphik ab 2001 J. bis 2015 J. Middle East & North Africa. Die Angaben bis 2000 J. sind nicht vorhanden. Die Zahl aktueller Beobachtungen nach Daten: 15.
Die Quelle (Bezeichnung):
Kennzahlen der Weltentwicklung
Die Quelle (Einrichtung):
United Nations Educational, Scientific, and Cultural Organization (UNESCO) Institute for Statistics.
Kategorien:
Education
Es wurde aktualisiert:
23 Apr 2017 Jahr
Kennzahlen der Wertänderungen vom Jahr zum Jahr
Minimum:
85.075
1 Jan 2013 Jahr
Maximum:
97.412
1 Jan 2001 Jahr
Zum Datum der Beobachtung
Wert
Absolute Veränderung
Die Veränderung bezüglich dem vorherigen Wert
1 Jan 2001 Jahr
97.412
+97.412
0.0%
1 Jan 2002 Jahr
96.848
-0.564
-0.58%
1 Jan 2003 Jahr
96.64
-0.208
-0.21%
1 Jan 2004 Jahr
96.957
+0.316
0.33%
1 Jan 2005 Jahr
97.133
+0.176
0.18%
1 Jan 2006 Jahr
94.595
-2.538
-2.61%
1 Jan 2007 Jahr
92.969
-1.626
-1.72%
1 Jan 2008 Jahr
92.262
-0.707
-0.76%
1 Jan 2009 Jahr
91.748
-0.514
-0.56%
1 Jan 2010 Jahr
92.418
+0.671
0.73%
1 Jan 2011 Jahr
92.441
+0.023
0.02%
1 Jan 2012 Jahr
86.655
-5.786
-6.26%
1 Jan 2013 Jahr
85.075
-1.579
-1.82%
1 Jan 2014 Jahr
87.095
+2.02
2.37%
1 Jan 2015 Jahr
86.977
-0.118
-0.14%
Bewertung der Länder gemäß mit laufender Statistik nach Jahren


Kommentare: