29
/de/
de
AIzaSyAYiBZKx7MnpbEhh9jyipgxe19OcubqV5w
April 1, 2024
42349
Latin America & Caribbean (excluding high income)
LAC
false
2
1
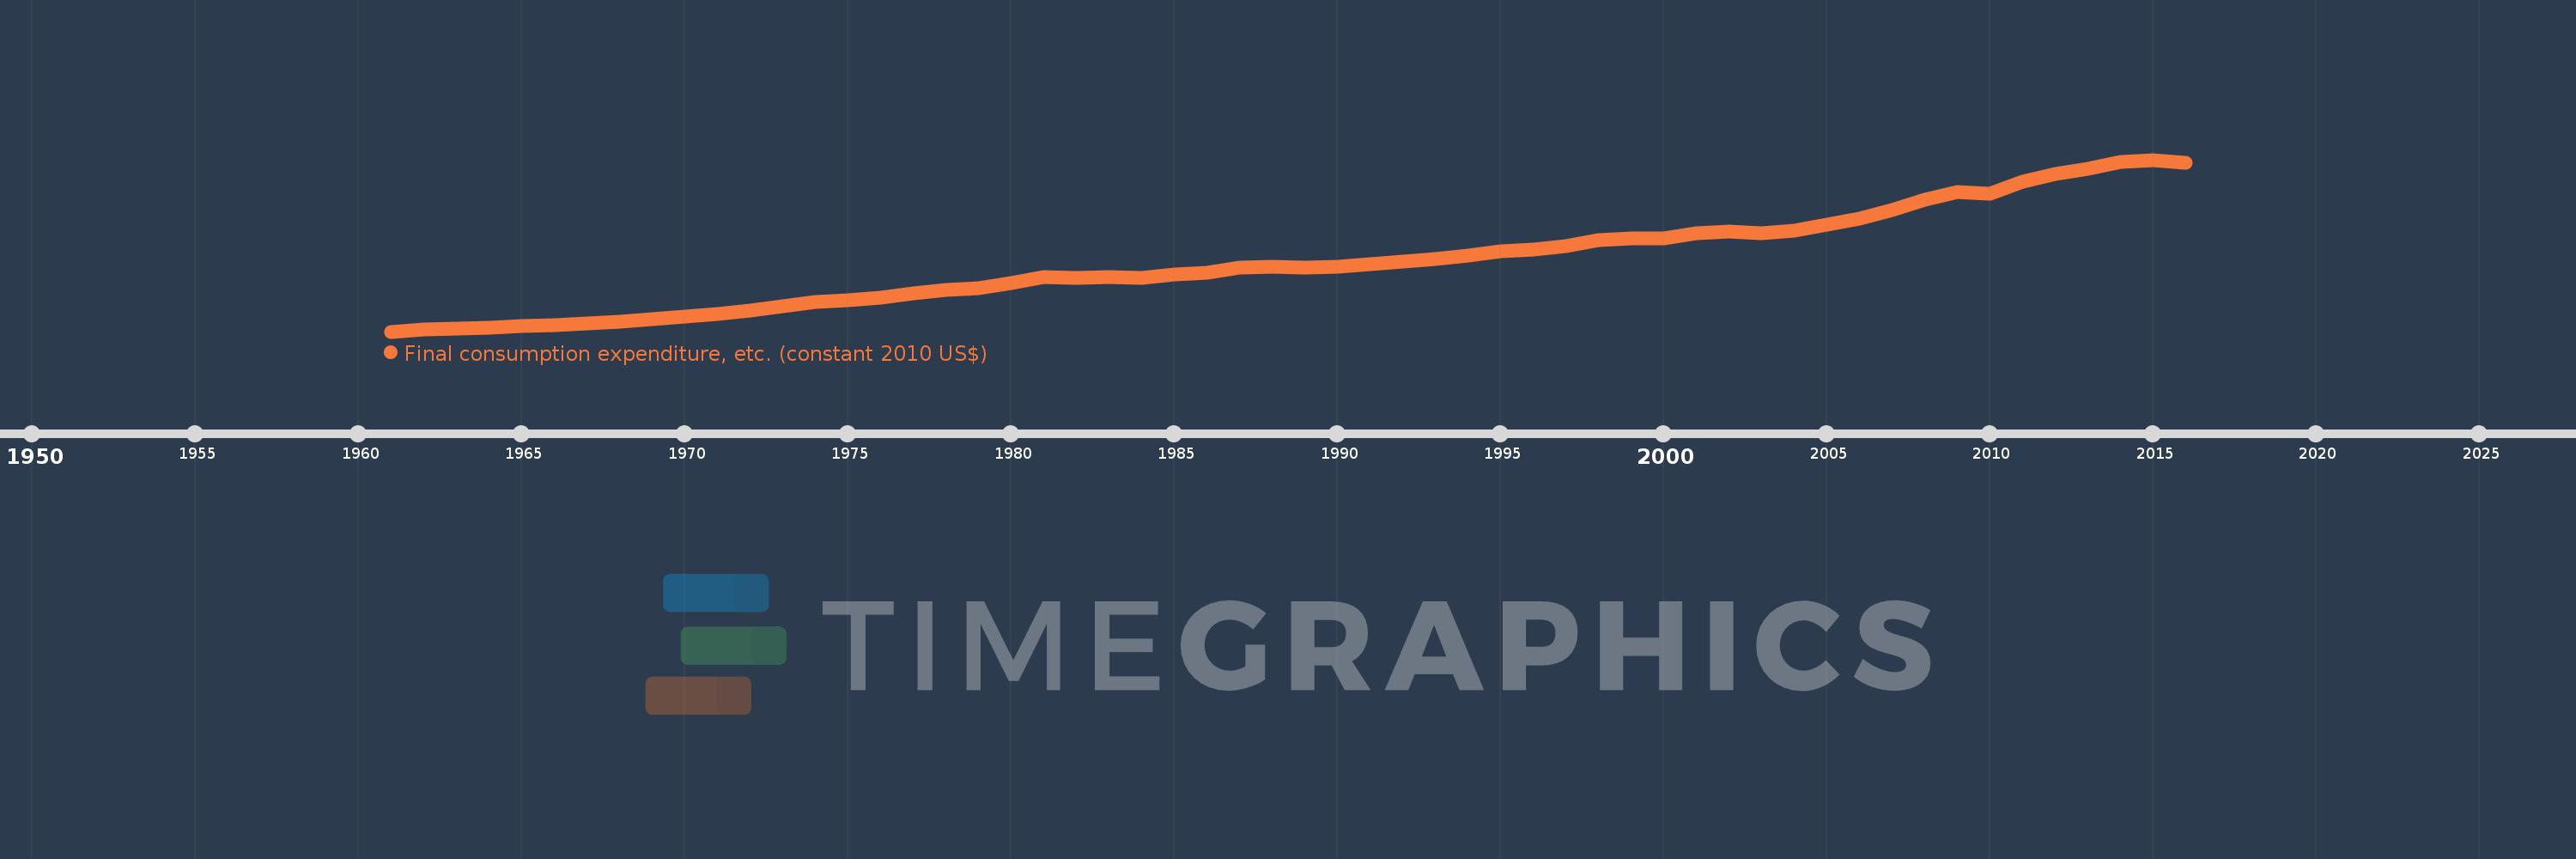
Final consumption expenditure, etc. (constant 2010 US$)
2016,2015,2014,2013,2012,2011,2010,2009,2008,2007,2006,2005,2004,2003,2002,2001,2000,1999,1998,1997,1996,1995,1994,1993,1992,1991,1990,1989,1988,1987,1986,1985,1984,1983,1982,1981,1980,1979,1978,1977,1976,1975,1974,1973,1972,1971,1970,1969,1968,1967,1966,1965,1964,1963,1962,1961
Diese Statistik in anderen Ländern:
AfghanistanAlbaniaAlgeriaAngolaAntigua and BarbudaArab WorldArgentinaArmeniaArubaAustraliaAustriaAzerbaijanBahamas, TheBahrainBangladeshBarbadosBelarusBelgiumBelizeBeninBermudaBhutanBoliviaBosnia and HerzegovinaBotswanaBrazilBrunei DarussalamBulgariaBurkina FasoBurundiCabo VerdeCambodiaCameroonCanadaCaribbean small statesCentral African RepublicCentral Europe and the BalticsChadChileChinaColombiaComorosCongo, Dem. Rep.Congo, Rep.Cote d'IvoireCroatiaCubaCyprusCzech RepublicDenmarkDominicaDominican RepublicEarly-demographic dividendEast Asia & PacificEast Asia & Pacific (excluding high income)East Asia & Pacific (IDA & IBRD countries)EcuadorEgypt, Arab Rep.El SalvadorEquatorial GuineaEritreaEstoniaEuro areaEurope & Central AsiaEurope & Central Asia (excluding high income)Europe & Central Asia (IDA & IBRD countries)European UnionFaroe IslandsFinlandFragile and conflict affected situationsFranceGabonGambia, TheGeorgiaGermanyGhanaGreeceGrenadaGuatemalaGuineaGuinea-BissauGuyanaHaitiHeavily indebted poor countries (HIPC)High incomeHondurasHong Kong SAR, ChinaHungaryIBRD onlyIcelandIDA & IBRD totalIDA blendIDA onlyIDA totalIndiaIndonesiaIran, Islamic Rep.IraqIrelandIsraelItalyJamaicaJapanJordanKazakhstanKenyaKorea, Rep.KosovoKuwaitKyrgyz RepublicLao PDRLate-demographic dividendLatin America & Caribbean Latin America & Caribbean (excluding high income)Latin America & the Caribbean (IDA & IBRD countries)LatviaLeast developed countries: UN classificationLebanonLiberiaLithuaniaLow & middle incomeLow incomeLower middle incomeLuxembourgMacao SAR, ChinaMacedonia, FYRMadagascarMalawiMalaysiaMaliMaltaMauritaniaMauritiusMexicoMiddle East & North AfricaMiddle East & North Africa (excluding high income)Middle East & North Africa (IDA & IBRD countries)Middle incomeMoldovaMongoliaMontenegroMoroccoMozambiqueNamibiaNepalNetherlandsNew ZealandNicaraguaNigerNigeriaNorth AmericaNorwayOECD membersOmanOther small statesPakistanPanamaParaguayPeruPhilippinesPolandPortugalPost-demographic dividendPre-demographic dividendPuerto RicoQatarRomaniaRussian FederationRwandaSaudi ArabiaSenegalSerbiaSeychellesSierra LeoneSingaporeSlovak RepublicSloveniaSmall statesSouth AfricaSouth AsiaSouth Asia (IDA & IBRD)South SudanSpainSri LankaSt. Kitts and NevisSt. LuciaSt. Vincent and the GrenadinesSub-Saharan Africa Sub-Saharan Africa (excluding high income)Sub-Saharan Africa (IDA & IBRD countries)SudanSurinameSwazilandSwedenSwitzerlandTajikistanTanzaniaThailandTimor-LesteTogoTongaTrinidad and TobagoTunisiaTurkeyTurkmenistanUgandaUkraineUnited Arab EmiratesUnited KingdomUnited StatesUpper middle incomeUruguayUzbekistanVanuatuVenezuela, RBVietnamWest Bank and GazaWorldYemen, Rep.ZambiaZimbabwe Zeitlinie:
Diese Zeitleiste vorliegt die Graphik ab 1961 J. bis 2016 J. Latin America & Caribbean (excluding high income). Die Angaben bis 1960 J. sind nicht vorhanden. Die Zahl aktueller Beobachtungen nach Daten: 56.
Die Quelle (Bezeichnung):
Kennzahlen der Weltentwicklung
Die Quelle (Einrichtung):
World Bank national accounts data, and OECD National Accounts data files.
Kategorien:
Economy & Growth
Es wurde aktualisiert:
23 Apr 2017 Jahr
Kennzahlen der Wertänderungen vom Jahr zum Jahr
im Durchschnitt:
2.113 Trln
Minimum:
562.751 Mlrd.
1 Jan 1961 Jahr
Maximum:
4.355 Trln
1 Jan 2015 Jahr
Zum Datum der Beobachtung
Wert
Absolute Veränderung
Die Veränderung bezüglich dem vorherigen Wert
1 Jan 1961 Jahr
562.751 Mlrd.
+562.751 Mlrd.
0.0%
1 Jan 1962 Jahr
602.511 Mlrd.
+39.76 Mlrd.
7.07%
1 Jan 1963 Jahr
631.312 Mlrd.
+28.801 Mlrd.
4.78%
1 Jan 1964 Jahr
647.971 Mlrd.
+16.66 Mlrd.
2.64%
1 Jan 1965 Jahr
688.577 Mlrd.
+40.606 Mlrd.
6.27%
1 Jan 1966 Jahr
704.66 Mlrd.
+16.083 Mlrd.
2.34%
1 Jan 1967 Jahr
735.211 Mlrd.
+30.551 Mlrd.
4.34%
1 Jan 1968 Jahr
780.425 Mlrd.
+45.214 Mlrd.
6.15%
1 Jan 1969 Jahr
835.078 Mlrd.
+54.653 Mlrd.
7.0%
1 Jan 1970 Jahr
887.644 Mlrd.
+52.566 Mlrd.
6.29%
1 Jan 1971 Jahr
957.615 Mlrd.
+69.971 Mlrd.
7.88%
1 Jan 1972 Jahr
1.036 Trln
+78.778 Mlrd.
8.23%
1 Jan 1973 Jahr
1.121 Trln
+84.607 Mlrd.
8.16%
1 Jan 1974 Jahr
1.222 Trln
+100.509 Mlrd.
8.97%
1 Jan 1975 Jahr
1.263 Trln
+41.297 Mlrd.
3.38%
1 Jan 1976 Jahr
1.318 Trln
+55.007 Mlrd.
4.36%
1 Jan 1977 Jahr
1.416 Trln
+98.111 Mlrd.
7.45%
1 Jan 1978 Jahr
1.483 Trln
+66.652 Mlrd.
4.71%
1 Jan 1979 Jahr
1.529 Trln
+46.577 Mlrd.
3.14%
1 Jan 1980 Jahr
1.635 Trln
+105.66 Mlrd.
6.91%
1 Jan 1981 Jahr
1.761 Trln
+126.218 Mlrd.
7.72%
1 Jan 1982 Jahr
1.753 Trln
-8.141 Mlrd.
-0.46%
1 Jan 1983 Jahr
1.772 Trln
+18.912 Mlrd.
1.08%
1 Jan 1984 Jahr
1.756 Trln
-16.07 Mlrd.
-0.91%
1 Jan 1985 Jahr
1.823 Trln
+66.831 Mlrd.
3.81%
1 Jan 1986 Jahr
1.855 Trln
+32.088 Mlrd.
1.76%
1 Jan 1987 Jahr
1.971 Trln
+116.572 Mlrd.
6.29%
1 Jan 1988 Jahr
1.99 Trln
+18.797 Mlrd.
0.95%
1 Jan 1989 Jahr
1.978 Trln
-12.458 Mlrd.
-0.63%
1 Jan 1990 Jahr
1.996 Trln
+18.902 Mlrd.
0.96%
1 Jan 1991 Jahr
2.051 Trln
+54.053 Mlrd.
2.71%
1 Jan 1992 Jahr
2.104 Trln
+53.154 Mlrd.
2.59%
1 Jan 1993 Jahr
2.168 Trln
+64.752 Mlrd.
3.08%
1 Jan 1994 Jahr
2.25 Trln
+81.581 Mlrd.
3.76%
1 Jan 1995 Jahr
2.339 Trln
+89.367 Mlrd.
3.97%
1 Jan 1996 Jahr
2.369 Trln
+29.74 Mlrd.
1.27%
1 Jan 1997 Jahr
2.452 Trln
+82.541 Mlrd.
3.48%
1 Jan 1998 Jahr
2.581 Trln
+128.966 Mlrd.
5.26%
1 Jan 1999 Jahr
2.625 Trln
+44.22 Mlrd.
1.71%
1 Jan 2000 Jahr
2.625 Trln
+632.809 Mln.
0.02%
1 Jan 2001 Jahr
2.732 Trln
+106.181 Mlrd.
4.04%
1 Jan 2002 Jahr
2.771 Trln
+38.966 Mlrd.
1.43%
1 Jan 2003 Jahr
2.743 Trln
-28.107 Mlrd.
-1.01%
1 Jan 2004 Jahr
2.789 Trln
+46.44 Mlrd.
1.69%
1 Jan 2005 Jahr
2.93 Trln
+141.009 Mlrd.
5.06%
1 Jan 2006 Jahr
3.064 Trln
+133.955 Mlrd.
4.57%
1 Jan 2007 Jahr
3.249 Trln
+185.293 Mlrd.
6.05%
1 Jan 2008 Jahr
3.471 Trln
+221.747 Mlrd.
6.82%
1 Jan 2009 Jahr
3.648 Trln
+176.742 Mlrd.
5.09%
1 Jan 2010 Jahr
3.61 Trln
-38.018 Mlrd.
-1.04%
1 Jan 2011 Jahr
3.866 Trln
+256.21 Mlrd.
7.1%
1 Jan 2012 Jahr
4.044 Trln
+178.525 Mlrd.
4.62%
1 Jan 2013 Jahr
4.166 Trln
+121.216 Mlrd.
3.0%
1 Jan 2014 Jahr
4.313 Trln
+147.067 Mlrd.
3.53%
1 Jan 2015 Jahr
4.355 Trln
+42.796 Mlrd.
0.99%
1 Jan 2016 Jahr
4.297 Trln
-58.313 Mlrd.
-1.34%
Bewertung der Länder gemäß mit laufender Statistik nach Jahren


Kommentare: