29
/de/
de
AIzaSyAYiBZKx7MnpbEhh9jyipgxe19OcubqV5w
April 1, 2024
39879
IDA total
IDA
false
2
1
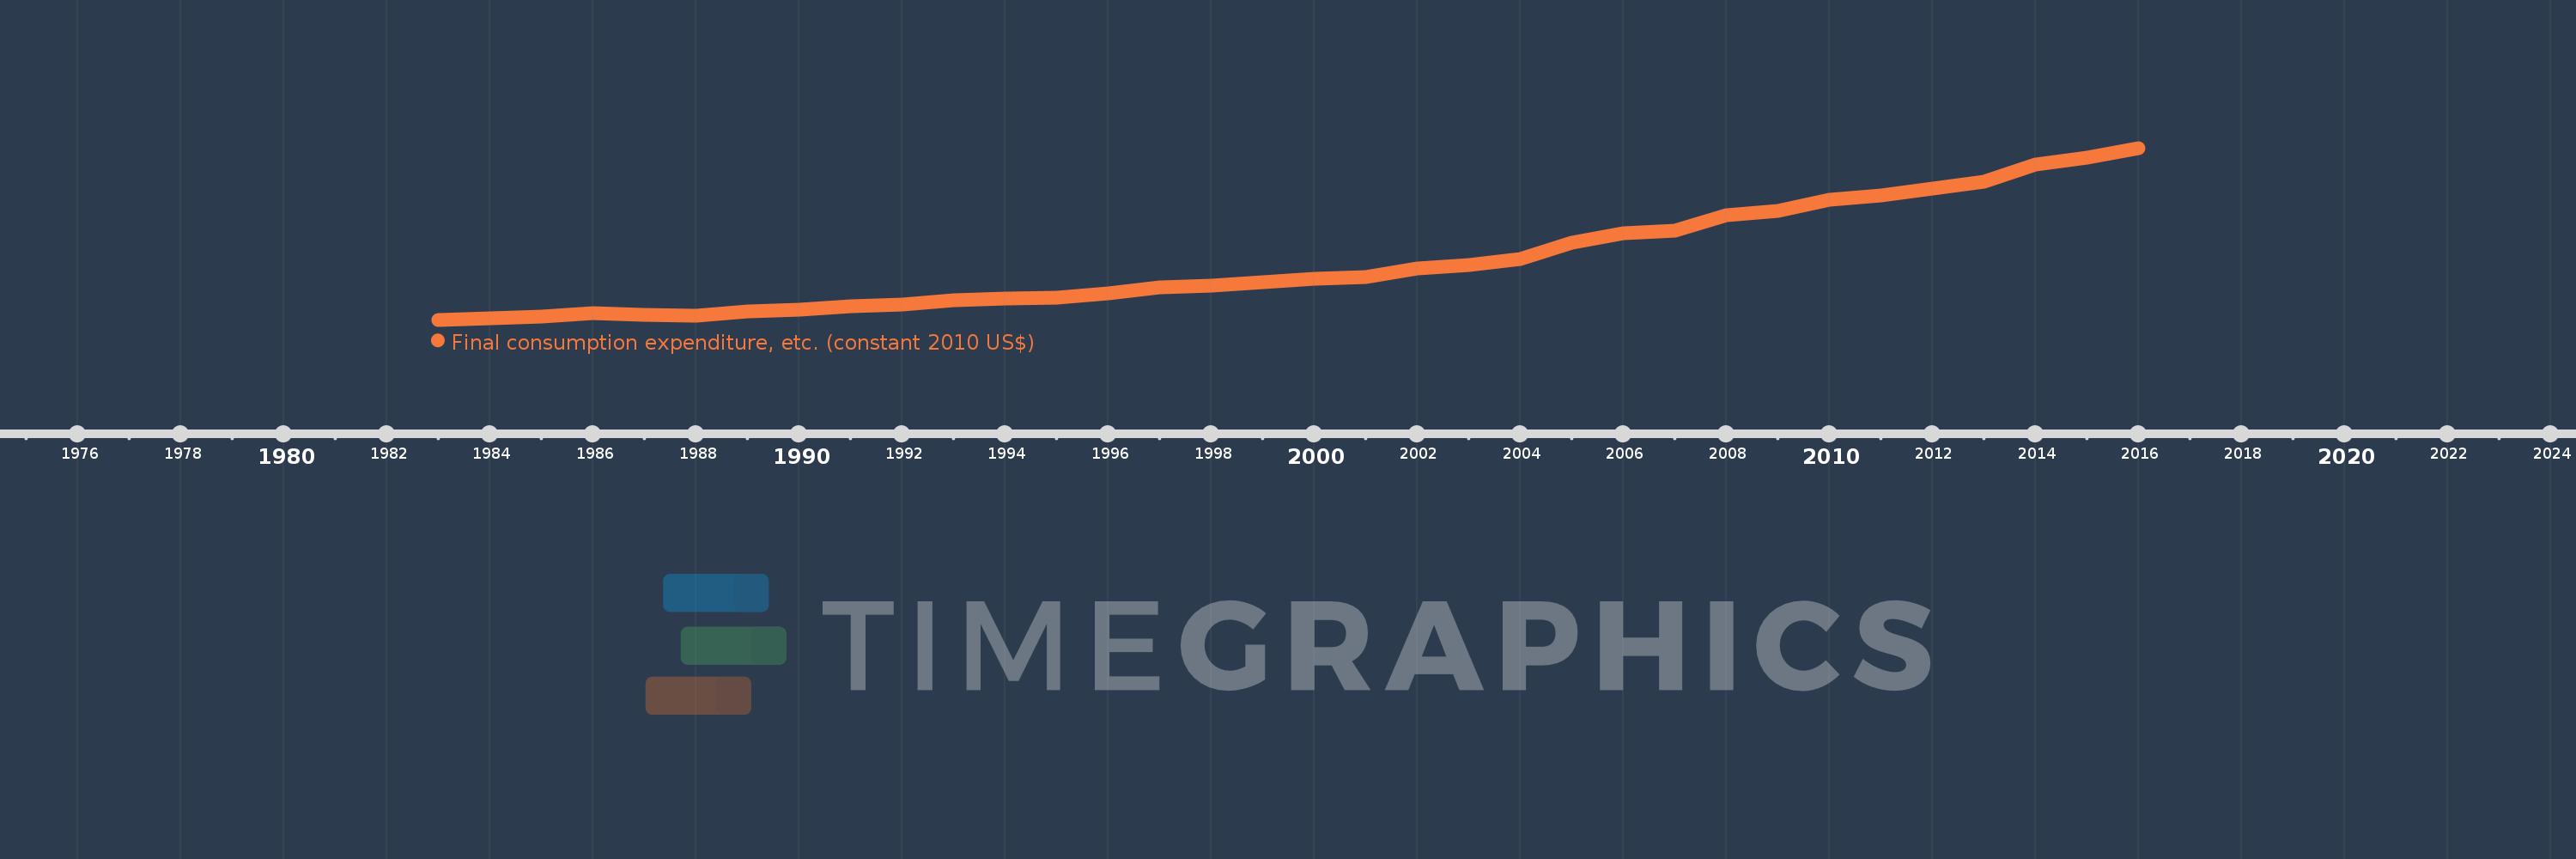
Final consumption expenditure, etc. (constant 2010 US$)
2016,2015,2014,2013,2012,2011,2010,2009,2008,2007,2006,2005,2004,2003,2002,2001,2000,1999,1998,1997,1996,1995,1994,1993,1992,1991,1990,1989,1988,1987,1986,1985,1984,1983
Diese Statistik in anderen Ländern:
AfghanistanAlbaniaAlgeriaAngolaAntigua and BarbudaArab WorldArgentinaArmeniaArubaAustraliaAustriaAzerbaijanBahamas, TheBahrainBangladeshBarbadosBelarusBelgiumBelizeBeninBermudaBhutanBoliviaBosnia and HerzegovinaBotswanaBrazilBrunei DarussalamBulgariaBurkina FasoBurundiCabo VerdeCambodiaCameroonCanadaCaribbean small statesCentral African RepublicCentral Europe and the BalticsChadChileChinaColombiaComorosCongo, Dem. Rep.Congo, Rep.Cote d'IvoireCroatiaCubaCyprusCzech RepublicDenmarkDominicaDominican RepublicEarly-demographic dividendEast Asia & PacificEast Asia & Pacific (excluding high income)East Asia & Pacific (IDA & IBRD countries)EcuadorEgypt, Arab Rep.El SalvadorEquatorial GuineaEritreaEstoniaEuro areaEurope & Central AsiaEurope & Central Asia (excluding high income)Europe & Central Asia (IDA & IBRD countries)European UnionFaroe IslandsFinlandFragile and conflict affected situationsFranceGabonGambia, TheGeorgiaGermanyGhanaGreeceGrenadaGuatemalaGuineaGuinea-BissauGuyanaHaitiHeavily indebted poor countries (HIPC)High incomeHondurasHong Kong SAR, ChinaHungaryIBRD onlyIcelandIDA & IBRD totalIDA blendIDA onlyIDA totalIndiaIndonesiaIran, Islamic Rep.IraqIrelandIsraelItalyJamaicaJapanJordanKazakhstanKenyaKorea, Rep.KosovoKuwaitKyrgyz RepublicLao PDRLate-demographic dividendLatin America & Caribbean Latin America & Caribbean (excluding high income)Latin America & the Caribbean (IDA & IBRD countries)LatviaLeast developed countries: UN classificationLebanonLiberiaLithuaniaLow & middle incomeLow incomeLower middle incomeLuxembourgMacao SAR, ChinaMacedonia, FYRMadagascarMalawiMalaysiaMaliMaltaMauritaniaMauritiusMexicoMiddle East & North AfricaMiddle East & North Africa (excluding high income)Middle East & North Africa (IDA & IBRD countries)Middle incomeMoldovaMongoliaMontenegroMoroccoMozambiqueNamibiaNepalNetherlandsNew ZealandNicaraguaNigerNigeriaNorth AmericaNorwayOECD membersOmanOther small statesPakistanPanamaParaguayPeruPhilippinesPolandPortugalPost-demographic dividendPre-demographic dividendPuerto RicoQatarRomaniaRussian FederationRwandaSaudi ArabiaSenegalSerbiaSeychellesSierra LeoneSingaporeSlovak RepublicSloveniaSmall statesSouth AfricaSouth AsiaSouth Asia (IDA & IBRD)South SudanSpainSri LankaSt. Kitts and NevisSt. LuciaSt. Vincent and the GrenadinesSub-Saharan Africa Sub-Saharan Africa (excluding high income)Sub-Saharan Africa (IDA & IBRD countries)SudanSurinameSwazilandSwedenSwitzerlandTajikistanTanzaniaThailandTimor-LesteTogoTongaTrinidad and TobagoTunisiaTurkeyTurkmenistanUgandaUkraineUnited Arab EmiratesUnited KingdomUnited StatesUpper middle incomeUruguayUzbekistanVanuatuVenezuela, RBVietnamWest Bank and GazaWorldYemen, Rep.ZambiaZimbabwe Zeitlinie:
Diese Zeitleiste vorliegt die Graphik ab 1983 J. bis 2016 J. IDA total. Die Angaben bis 1982 J. sind nicht vorhanden. Die Zahl aktueller Beobachtungen nach Daten: 34.
Die Quelle (Bezeichnung):
Kennzahlen der Weltentwicklung
Die Quelle (Einrichtung):
World Bank national accounts data, and OECD National Accounts data files.
Kategorien:
Economy & Growth
Es wurde aktualisiert:
23 Apr 2017 Jahr
Kennzahlen der Wertänderungen vom Jahr zum Jahr
im Durchschnitt:
877.987 Mlrd.
Minimum:
460.942 Mlrd.
1 Jan 1983 Jahr
Maximum:
1.691 Trln
1 Jan 2016 Jahr
Zum Datum der Beobachtung
Wert
Absolute Veränderung
Die Veränderung bezüglich dem vorherigen Wert
1 Jan 1983 Jahr
460.942 Mlrd.
+460.942 Mlrd.
0.0%
1 Jan 1984 Jahr
471.121 Mlrd.
+10.18 Mlrd.
2.21%
1 Jan 1985 Jahr
484.77 Mlrd.
+13.649 Mlrd.
2.9%
1 Jan 1986 Jahr
506.345 Mlrd.
+21.575 Mlrd.
4.45%
1 Jan 1987 Jahr
496.047 Mlrd.
-10.298 Mlrd.
-2.03%
1 Jan 1988 Jahr
492.355 Mlrd.
-3.692 Mlrd.
-0.74%
1 Jan 1989 Jahr
522.541 Mlrd.
+30.186 Mlrd.
6.13%
1 Jan 1990 Jahr
530.017 Mlrd.
+7.476 Mlrd.
1.43%
1 Jan 1991 Jahr
559.708 Mlrd.
+29.691 Mlrd.
5.6%
1 Jan 1992 Jahr
567.783 Mlrd.
+8.075 Mlrd.
1.44%
1 Jan 1993 Jahr
597.585 Mlrd.
+29.803 Mlrd.
5.25%
1 Jan 1994 Jahr
613.035 Mlrd.
+15.449 Mlrd.
2.59%
1 Jan 1995 Jahr
618.408 Mlrd.
+5.374 Mlrd.
0.88%
1 Jan 1996 Jahr
651.884 Mlrd.
+33.476 Mlrd.
5.41%
1 Jan 1997 Jahr
694.521 Mlrd.
+42.637 Mlrd.
6.54%
1 Jan 1998 Jahr
705.457 Mlrd.
+10.936 Mlrd.
1.57%
1 Jan 1999 Jahr
731.994 Mlrd.
+26.537 Mlrd.
3.76%
1 Jan 2000 Jahr
754.194 Mlrd.
+22.2 Mlrd.
3.03%
1 Jan 2001 Jahr
769.658 Mlrd.
+15.464 Mlrd.
2.05%
1 Jan 2002 Jahr
827.092 Mlrd.
+57.434 Mlrd.
7.46%
1 Jan 2003 Jahr
849.847 Mlrd.
+22.755 Mlrd.
2.75%
1 Jan 2004 Jahr
893.474 Mlrd.
+43.626 Mlrd.
5.13%
1 Jan 2005 Jahr
1.013 Trln
+119.085 Mlrd.
13.33%
1 Jan 2006 Jahr
1.083 Trln
+69.998 Mlrd.
6.91%
1 Jan 2007 Jahr
1.099 Trln
+16.85 Mlrd.
1.56%
1 Jan 2008 Jahr
1.212 Trln
+113.05 Mlrd.
10.28%
1 Jan 2009 Jahr
1.241 Trln
+28.214 Mlrd.
2.33%
1 Jan 2010 Jahr
1.319 Trln
+78.094 Mlrd.
6.29%
1 Jan 2011 Jahr
1.352 Trln
+33.18 Mlrd.
2.52%
1 Jan 2012 Jahr
1.398 Trln
+45.635 Mlrd.
3.38%
1 Jan 2013 Jahr
1.451 Trln
+53.317 Mlrd.
3.81%
1 Jan 2014 Jahr
1.572 Trln
+121.003 Mlrd.
8.34%
1 Jan 2015 Jahr
1.623 Trln
+50.861 Mlrd.
3.24%
1 Jan 2016 Jahr
1.691 Trln
+68.53 Mlrd.
4.22%
Bewertung der Länder gemäß mit laufender Statistik nach Jahren


Kommentare: