29
/de/
de
AIzaSyAYiBZKx7MnpbEhh9jyipgxe19OcubqV5w
April 1, 2024
134075
France
FRA
true
2
1
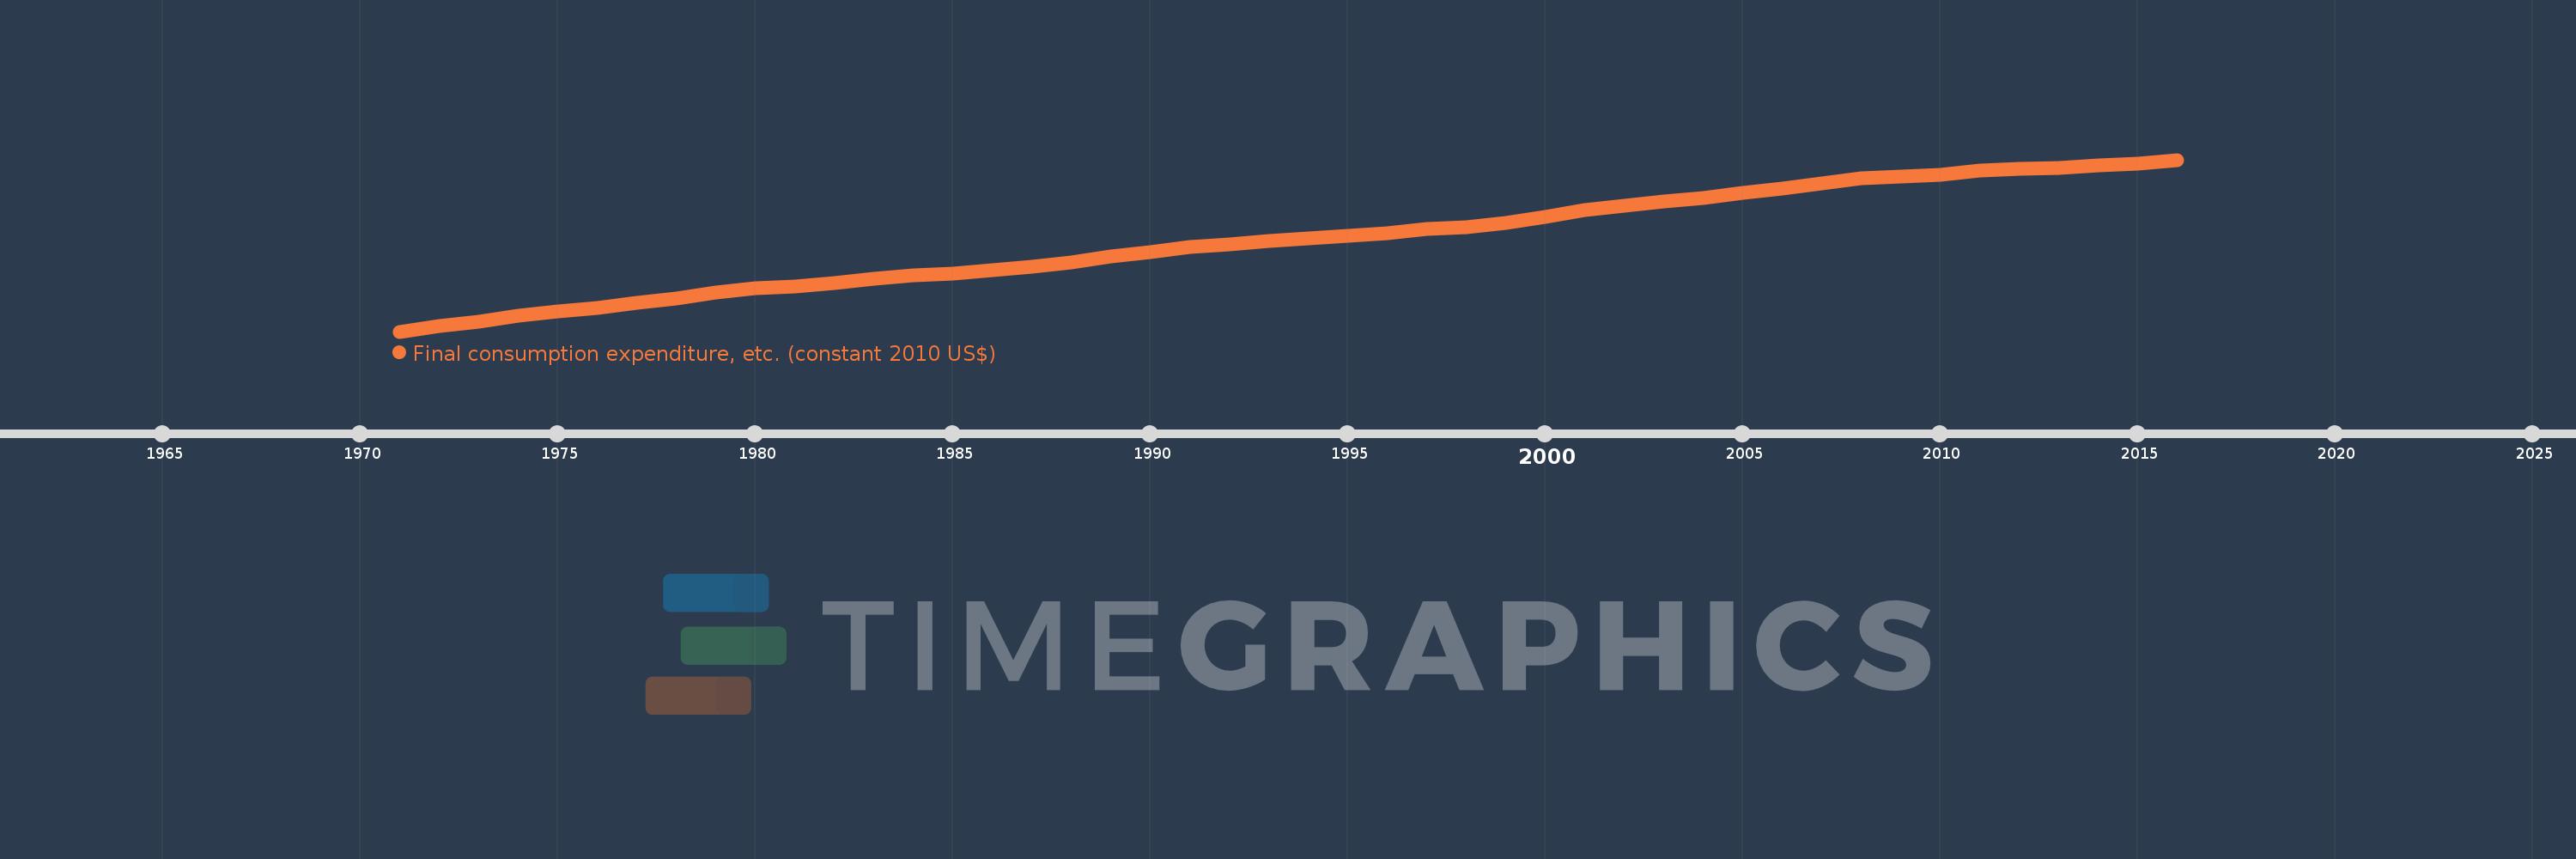
Final consumption expenditure, etc. (constant 2010 US$)
2016,2015,2014,2013,2012,2011,2010,2009,2008,2007,2006,2005,2004,2003,2002,2001,2000,1999,1998,1997,1996,1995,1994,1993,1992,1991,1990,1989,1988,1987,1986,1985,1984,1983,1982,1981,1980,1979,1978,1977,1976,1975,1974,1973,1972,1971
Diese Statistik in anderen Ländern:
AfghanistanAlbaniaAlgeriaAngolaAntigua and BarbudaArab WorldArgentinaArmeniaArubaAustraliaAustriaAzerbaijanBahamas, TheBahrainBangladeshBarbadosBelarusBelgiumBelizeBeninBermudaBhutanBoliviaBosnia and HerzegovinaBotswanaBrazilBrunei DarussalamBulgariaBurkina FasoBurundiCabo VerdeCambodiaCameroonCanadaCaribbean small statesCentral African RepublicCentral Europe and the BalticsChadChileChinaColombiaComorosCongo, Dem. Rep.Congo, Rep.Cote d'IvoireCroatiaCubaCyprusCzech RepublicDenmarkDominicaDominican RepublicEarly-demographic dividendEast Asia & PacificEast Asia & Pacific (excluding high income)East Asia & Pacific (IDA & IBRD countries)EcuadorEgypt, Arab Rep.El SalvadorEquatorial GuineaEritreaEstoniaEuro areaEurope & Central AsiaEurope & Central Asia (excluding high income)Europe & Central Asia (IDA & IBRD countries)European UnionFaroe IslandsFinlandFragile and conflict affected situationsFranceGabonGambia, TheGeorgiaGermanyGhanaGreeceGrenadaGuatemalaGuineaGuinea-BissauGuyanaHaitiHeavily indebted poor countries (HIPC)High incomeHondurasHong Kong SAR, ChinaHungaryIBRD onlyIcelandIDA & IBRD totalIDA blendIDA onlyIDA totalIndiaIndonesiaIran, Islamic Rep.IraqIrelandIsraelItalyJamaicaJapanJordanKazakhstanKenyaKorea, Rep.KosovoKuwaitKyrgyz RepublicLao PDRLate-demographic dividendLatin America & Caribbean Latin America & Caribbean (excluding high income)Latin America & the Caribbean (IDA & IBRD countries)LatviaLeast developed countries: UN classificationLebanonLiberiaLithuaniaLow & middle incomeLow incomeLower middle incomeLuxembourgMacao SAR, ChinaMacedonia, FYRMadagascarMalawiMalaysiaMaliMaltaMauritaniaMauritiusMexicoMiddle East & North AfricaMiddle East & North Africa (excluding high income)Middle East & North Africa (IDA & IBRD countries)Middle incomeMoldovaMongoliaMontenegroMoroccoMozambiqueNamibiaNepalNetherlandsNew ZealandNicaraguaNigerNigeriaNorth AmericaNorwayOECD membersOmanOther small statesPakistanPanamaParaguayPeruPhilippinesPolandPortugalPost-demographic dividendPre-demographic dividendPuerto RicoQatarRomaniaRussian FederationRwandaSaudi ArabiaSenegalSerbiaSeychellesSierra LeoneSingaporeSlovak RepublicSloveniaSmall statesSouth AfricaSouth AsiaSouth Asia (IDA & IBRD)South SudanSpainSri LankaSt. Kitts and NevisSt. LuciaSt. Vincent and the GrenadinesSub-Saharan Africa Sub-Saharan Africa (excluding high income)Sub-Saharan Africa (IDA & IBRD countries)SudanSurinameSwazilandSwedenSwitzerlandTajikistanTanzaniaThailandTimor-LesteTogoTongaTrinidad and TobagoTunisiaTurkeyTurkmenistanUgandaUkraineUnited Arab EmiratesUnited KingdomUnited StatesUpper middle incomeUruguayUzbekistanVanuatuVenezuela, RBVietnamWest Bank and GazaWorldYemen, Rep.ZambiaZimbabwe Zeitlinie:
Diese Zeitleiste vorliegt die Graphik ab 1971 J. bis 2016 J. France. Die Angaben bis 1970 J. sind nicht vorhanden. Die Zahl aktueller Beobachtungen nach Daten: 46.
Die Quelle (Bezeichnung):
Kennzahlen der Weltentwicklung
Die Quelle (Einrichtung):
World Bank national accounts data, and OECD National Accounts data files.
Kategorien:
Economy & Growth
Es wurde aktualisiert:
23 Apr 2017 Jahr
Kennzahlen der Wertänderungen vom Jahr zum Jahr
im Durchschnitt:
1.535 Trln
Minimum:
772.166 Mlrd.
1 Jan 1971 Jahr
Maximum:
2.204 Trln
1 Jan 2016 Jahr
Zum Datum der Beobachtung
Wert
Absolute Veränderung
Die Veränderung bezüglich dem vorherigen Wert
1 Jan 1971 Jahr
772.166 Mlrd.
+772.166 Mlrd.
0.0%
1 Jan 1972 Jahr
818.302 Mlrd.
+46.136 Mlrd.
5.97%
1 Jan 1973 Jahr
857.77 Mlrd.
+39.468 Mlrd.
4.82%
1 Jan 1974 Jahr
907.766 Mlrd.
+49.996 Mlrd.
5.83%
1 Jan 1975 Jahr
942.938 Mlrd.
+35.172 Mlrd.
3.87%
1 Jan 1976 Jahr
971.743 Mlrd.
+28.805 Mlrd.
3.05%
1 Jan 1977 Jahr
1.013 Trln
+41.632 Mlrd.
4.28%
1 Jan 1978 Jahr
1.046 Trln
+32.989 Mlrd.
3.26%
1 Jan 1979 Jahr
1.096 Trln
+49.14 Mlrd.
4.7%
1 Jan 1980 Jahr
1.132 Trln
+36.188 Mlrd.
3.3%
1 Jan 1981 Jahr
1.149 Trln
+17.547 Mlrd.
1.55%
1 Jan 1982 Jahr
1.18 Trln
+30.612 Mlrd.
2.66%
1 Jan 1983 Jahr
1.216 Trln
+36.038 Mlrd.
3.05%
1 Jan 1984 Jahr
1.241 Trln
+25.034 Mlrd.
2.06%
1 Jan 1985 Jahr
1.259 Trln
+17.577 Mlrd.
1.42%
1 Jan 1986 Jahr
1.281 Trln
+22.97 Mlrd.
1.83%
1 Jan 1987 Jahr
1.314 Trln
+32.232 Mlrd.
2.52%
1 Jan 1988 Jahr
1.35 Trln
+36.54 Mlrd.
2.78%
1 Jan 1989 Jahr
1.397 Trln
+46.371 Mlrd.
3.43%
1 Jan 1990 Jahr
1.437 Trln
+40.706 Mlrd.
2.91%
1 Jan 1991 Jahr
1.476 Trln
+38.821 Mlrd.
2.7%
1 Jan 1992 Jahr
1.5 Trln
+24.319 Mlrd.
1.65%
1 Jan 1993 Jahr
1.53 Trln
+29.689 Mlrd.
1.98%
1 Jan 1994 Jahr
1.548 Trln
+17.679 Mlrd.
1.16%
1 Jan 1995 Jahr
1.568 Trln
+20.552 Mlrd.
1.33%
1 Jan 1996 Jahr
1.589 Trln
+21.06 Mlrd.
1.34%
1 Jan 1997 Jahr
1.624 Trln
+34.702 Mlrd.
2.18%
1 Jan 1998 Jahr
1.64 Trln
+16.144 Mlrd.
0.99%
1 Jan 1999 Jahr
1.681 Trln
+40.564 Mlrd.
2.47%
1 Jan 2000 Jahr
1.729 Trln
+47.891 Mlrd.
2.85%
1 Jan 2001 Jahr
1.782 Trln
+53.713 Mlrd.
3.11%
1 Jan 2002 Jahr
1.821 Trln
+38.466 Mlrd.
2.16%
1 Jan 2003 Jahr
1.858 Trln
+37.171 Mlrd.
2.04%
1 Jan 2004 Jahr
1.888 Trln
+29.628 Mlrd.
1.59%
1 Jan 2005 Jahr
1.926 Trln
+38.069 Mlrd.
2.02%
1 Jan 2006 Jahr
1.967 Trln
+41.0 Mlrd.
2.13%
1 Jan 2007 Jahr
2.005 Trln
+38.045 Mlrd.
1.93%
1 Jan 2008 Jahr
2.05 Trln
+44.775 Mlrd.
2.23%
1 Jan 2009 Jahr
2.063 Trln
+13.099 Mlrd.
0.64%
1 Jan 2010 Jahr
2.081 Trln
+18.775 Mlrd.
0.91%
1 Jan 2011 Jahr
2.117 Trln
+35.338 Mlrd.
1.7%
1 Jan 2012 Jahr
2.13 Trln
+13.587 Mlrd.
0.64%
1 Jan 2013 Jahr
2.137 Trln
+6.946 Mlrd.
0.33%
1 Jan 2014 Jahr
2.154 Trln
+16.403 Mlrd.
0.77%
1 Jan 2015 Jahr
2.171 Trln
+17.342 Mlrd.
0.81%
1 Jan 2016 Jahr
2.204 Trln
+32.51 Mlrd.
1.5%
Bewertung der Länder gemäß mit laufender Statistik nach Jahren


Kommentare: