29
/de/
de
AIzaSyAYiBZKx7MnpbEhh9jyipgxe19OcubqV5w
April 1, 2024
35704
High income
HIC
false
2
1
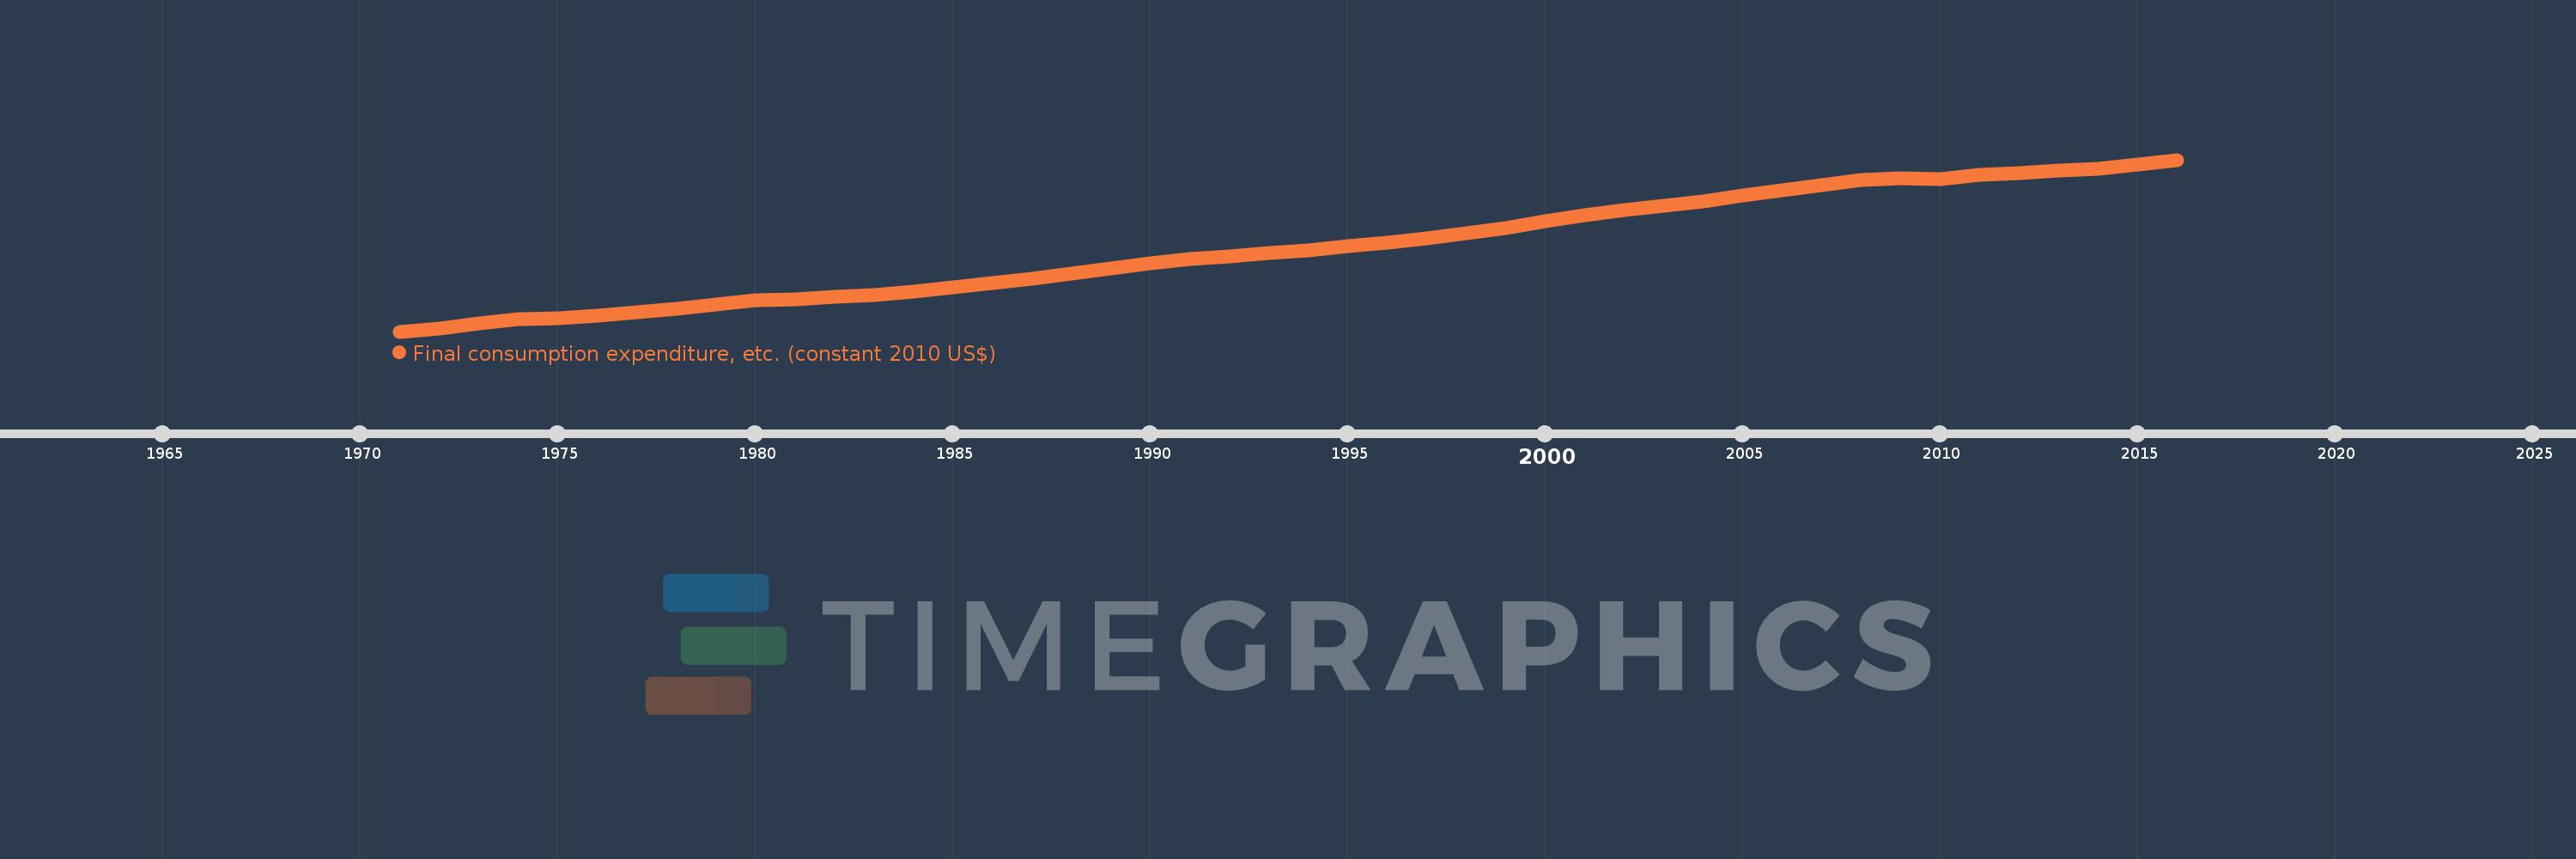
Final consumption expenditure, etc. (constant 2010 US$)
2016,2015,2014,2013,2012,2011,2010,2009,2008,2007,2006,2005,2004,2003,2002,2001,2000,1999,1998,1997,1996,1995,1994,1993,1992,1991,1990,1989,1988,1987,1986,1985,1984,1983,1982,1981,1980,1979,1978,1977,1976,1975,1974,1973,1972,1971
Diese Statistik in anderen Ländern:
AfghanistanAlbaniaAlgeriaAngolaAntigua and BarbudaArab WorldArgentinaArmeniaArubaAustraliaAustriaAzerbaijanBahamas, TheBahrainBangladeshBarbadosBelarusBelgiumBelizeBeninBermudaBhutanBoliviaBosnia and HerzegovinaBotswanaBrazilBrunei DarussalamBulgariaBurkina FasoBurundiCabo VerdeCambodiaCameroonCanadaCaribbean small statesCentral African RepublicCentral Europe and the BalticsChadChileChinaColombiaComorosCongo, Dem. Rep.Congo, Rep.Cote d'IvoireCroatiaCubaCyprusCzech RepublicDenmarkDominicaDominican RepublicEarly-demographic dividendEast Asia & PacificEast Asia & Pacific (excluding high income)East Asia & Pacific (IDA & IBRD countries)EcuadorEgypt, Arab Rep.El SalvadorEquatorial GuineaEritreaEstoniaEuro areaEurope & Central AsiaEurope & Central Asia (excluding high income)Europe & Central Asia (IDA & IBRD countries)European UnionFaroe IslandsFinlandFragile and conflict affected situationsFranceGabonGambia, TheGeorgiaGermanyGhanaGreeceGrenadaGuatemalaGuineaGuinea-BissauGuyanaHaitiHeavily indebted poor countries (HIPC)High incomeHondurasHong Kong SAR, ChinaHungaryIBRD onlyIcelandIDA & IBRD totalIDA blendIDA onlyIDA totalIndiaIndonesiaIran, Islamic Rep.IraqIrelandIsraelItalyJamaicaJapanJordanKazakhstanKenyaKorea, Rep.KosovoKuwaitKyrgyz RepublicLao PDRLate-demographic dividendLatin America & Caribbean Latin America & Caribbean (excluding high income)Latin America & the Caribbean (IDA & IBRD countries)LatviaLeast developed countries: UN classificationLebanonLiberiaLithuaniaLow & middle incomeLow incomeLower middle incomeLuxembourgMacao SAR, ChinaMacedonia, FYRMadagascarMalawiMalaysiaMaliMaltaMauritaniaMauritiusMexicoMiddle East & North AfricaMiddle East & North Africa (excluding high income)Middle East & North Africa (IDA & IBRD countries)Middle incomeMoldovaMongoliaMontenegroMoroccoMozambiqueNamibiaNepalNetherlandsNew ZealandNicaraguaNigerNigeriaNorth AmericaNorwayOECD membersOmanOther small statesPakistanPanamaParaguayPeruPhilippinesPolandPortugalPost-demographic dividendPre-demographic dividendPuerto RicoQatarRomaniaRussian FederationRwandaSaudi ArabiaSenegalSerbiaSeychellesSierra LeoneSingaporeSlovak RepublicSloveniaSmall statesSouth AfricaSouth AsiaSouth Asia (IDA & IBRD)South SudanSpainSri LankaSt. Kitts and NevisSt. LuciaSt. Vincent and the GrenadinesSub-Saharan Africa Sub-Saharan Africa (excluding high income)Sub-Saharan Africa (IDA & IBRD countries)SudanSurinameSwazilandSwedenSwitzerlandTajikistanTanzaniaThailandTimor-LesteTogoTongaTrinidad and TobagoTunisiaTurkeyTurkmenistanUgandaUkraineUnited Arab EmiratesUnited KingdomUnited StatesUpper middle incomeUruguayUzbekistanVanuatuVenezuela, RBVietnamWest Bank and GazaWorldYemen, Rep.ZambiaZimbabwe Zeitlinie:
Diese Zeitleiste vorliegt die Graphik ab 1971 J. bis 2016 J. High income. Die Angaben bis 1970 J. sind nicht vorhanden. Die Zahl aktueller Beobachtungen nach Daten: 46.
Die Quelle (Bezeichnung):
Kennzahlen der Weltentwicklung
Die Quelle (Einrichtung):
World Bank national accounts data, and OECD National Accounts data files.
Kategorien:
Economy & Growth
Es wurde aktualisiert:
23 Apr 2017 Jahr
Kennzahlen der Wertänderungen vom Jahr zum Jahr
im Durchschnitt:
24.575 Trln
Minimum:
11.793 Trln
1 Jan 1971 Jahr
Maximum:
37.881 Trln
1 Jan 2016 Jahr
Zum Datum der Beobachtung
Wert
Absolute Veränderung
Die Veränderung bezüglich dem vorherigen Wert
1 Jan 1971 Jahr
11.793 Trln
+11.793 Trln
0.0%
1 Jan 1972 Jahr
12.301 Trln
+508.152 Mlrd.
4.31%
1 Jan 1973 Jahr
12.986 Trln
+684.569 Mlrd.
5.56%
1 Jan 1974 Jahr
13.655 Trln
+669.473 Mlrd.
5.16%
1 Jan 1975 Jahr
13.854 Trln
+198.358 Mlrd.
1.45%
1 Jan 1976 Jahr
14.192 Trln
+338.701 Mlrd.
2.44%
1 Jan 1977 Jahr
14.775 Trln
+582.163 Mlrd.
4.1%
1 Jan 1978 Jahr
15.313 Trln
+538.795 Mlrd.
3.65%
1 Jan 1979 Jahr
15.951 Trln
+637.473 Mlrd.
4.16%
1 Jan 1980 Jahr
16.517 Trln
+565.917 Mlrd.
3.55%
1 Jan 1981 Jahr
16.749 Trln
+232.224 Mlrd.
1.41%
1 Jan 1982 Jahr
17.105 Trln
+356.19 Mlrd.
2.13%
1 Jan 1983 Jahr
17.337 Trln
+231.75 Mlrd.
1.35%
1 Jan 1984 Jahr
17.891 Trln
+553.568 Mlrd.
3.19%
1 Jan 1985 Jahr
18.492 Trln
+601.547 Mlrd.
3.36%
1 Jan 1986 Jahr
19.198 Trln
+705.837 Mlrd.
3.82%
1 Jan 1987 Jahr
19.86 Trln
+661.804 Mlrd.
3.45%
1 Jan 1988 Jahr
20.556 Trln
+696.636 Mlrd.
3.51%
1 Jan 1989 Jahr
21.378 Trln
+821.379 Mlrd.
4.0%
1 Jan 1990 Jahr
22.117 Trln
+739.456 Mlrd.
3.46%
1 Jan 1991 Jahr
22.76 Trln
+642.904 Mlrd.
2.91%
1 Jan 1992 Jahr
23.147 Trln
+387.223 Mlrd.
1.7%
1 Jan 1993 Jahr
23.715 Trln
+568.049 Mlrd.
2.45%
1 Jan 1994 Jahr
24.084 Trln
+368.292 Mlrd.
1.55%
1 Jan 1995 Jahr
24.72 Trln
+636.567 Mlrd.
2.64%
1 Jan 1996 Jahr
25.282 Trln
+561.631 Mlrd.
2.27%
1 Jan 1997 Jahr
25.989 Trln
+707.445 Mlrd.
2.8%
1 Jan 1998 Jahr
26.692 Trln
+702.372 Mlrd.
2.7%
1 Jan 1999 Jahr
27.461 Trln
+769.664 Mlrd.
2.88%
1 Jan 2000 Jahr
28.491 Trln
+1.029 Trln
3.75%
1 Jan 2001 Jahr
29.458 Trln
+967.727 Mlrd.
3.4%
1 Jan 2002 Jahr
30.189 Trln
+730.705 Mlrd.
2.48%
1 Jan 2003 Jahr
30.916 Trln
+726.953 Mlrd.
2.41%
1 Jan 2004 Jahr
31.583 Trln
+667.015 Mlrd.
2.16%
1 Jan 2005 Jahr
32.442 Trln
+858.806 Mlrd.
2.72%
1 Jan 2006 Jahr
33.268 Trln
+826.302 Mlrd.
2.55%
1 Jan 2007 Jahr
34.093 Trln
+825.2 Mlrd.
2.48%
1 Jan 2008 Jahr
34.864 Trln
+771.255 Mlrd.
2.26%
1 Jan 2009 Jahr
35.101 Trln
+236.059 Mlrd.
0.68%
1 Jan 2010 Jahr
34.959 Trln
-141.91 Mlrd.
-0.4%
1 Jan 2011 Jahr
35.558 Trln
+599.081 Mlrd.
1.71%
1 Jan 2012 Jahr
35.909 Trln
+351.494 Mlrd.
0.99%
1 Jan 2013 Jahr
36.213 Trln
+303.716 Mlrd.
0.85%
1 Jan 2014 Jahr
36.533 Trln
+320.39 Mlrd.
0.88%
1 Jan 2015 Jahr
37.116 Trln
+583.114 Mlrd.
1.6%
1 Jan 2016 Jahr
37.881 Trln
+764.301 Mlrd.
2.06%
Bewertung der Länder gemäß mit laufender Statistik nach Jahren


Kommentare: