29
/de/
de
AIzaSyAYiBZKx7MnpbEhh9jyipgxe19OcubqV5w
April 1, 2024
41418
Latin America & Caribbean
LCN
false
2
1
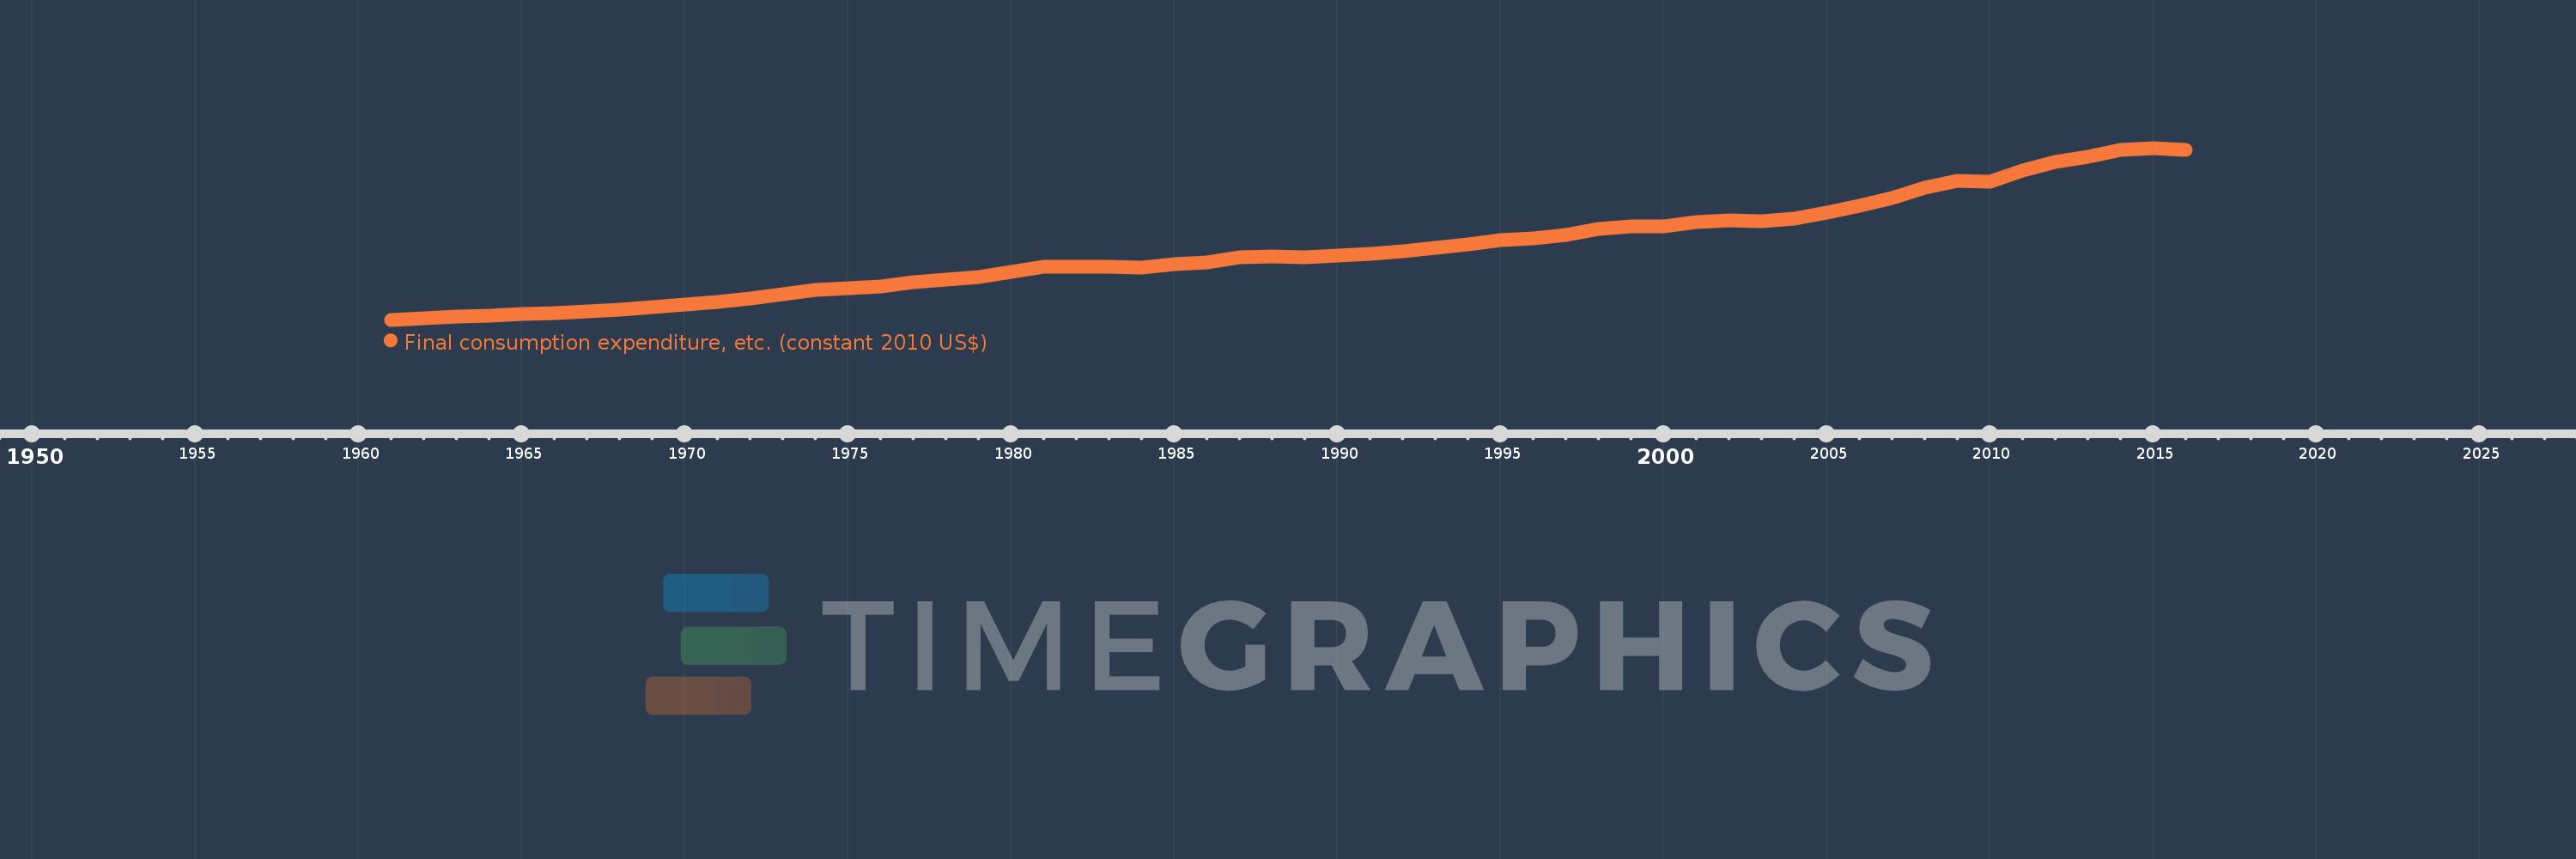
Final consumption expenditure, etc. (constant 2010 US$)
2016,2015,2014,2013,2012,2011,2010,2009,2008,2007,2006,2005,2004,2003,2002,2001,2000,1999,1998,1997,1996,1995,1994,1993,1992,1991,1990,1989,1988,1987,1986,1985,1984,1983,1982,1981,1980,1979,1978,1977,1976,1975,1974,1973,1972,1971,1970,1969,1968,1967,1966,1965,1964,1963,1962,1961
Diese Statistik in anderen Ländern:
AfghanistanAlbaniaAlgeriaAngolaAntigua and BarbudaArab WorldArgentinaArmeniaArubaAustraliaAustriaAzerbaijanBahamas, TheBahrainBangladeshBarbadosBelarusBelgiumBelizeBeninBermudaBhutanBoliviaBosnia and HerzegovinaBotswanaBrazilBrunei DarussalamBulgariaBurkina FasoBurundiCabo VerdeCambodiaCameroonCanadaCaribbean small statesCentral African RepublicCentral Europe and the BalticsChadChileChinaColombiaComorosCongo, Dem. Rep.Congo, Rep.Cote d'IvoireCroatiaCubaCyprusCzech RepublicDenmarkDominicaDominican RepublicEarly-demographic dividendEast Asia & PacificEast Asia & Pacific (excluding high income)East Asia & Pacific (IDA & IBRD countries)EcuadorEgypt, Arab Rep.El SalvadorEquatorial GuineaEritreaEstoniaEuro areaEurope & Central AsiaEurope & Central Asia (excluding high income)Europe & Central Asia (IDA & IBRD countries)European UnionFaroe IslandsFinlandFragile and conflict affected situationsFranceGabonGambia, TheGeorgiaGermanyGhanaGreeceGrenadaGuatemalaGuineaGuinea-BissauGuyanaHaitiHeavily indebted poor countries (HIPC)High incomeHondurasHong Kong SAR, ChinaHungaryIBRD onlyIcelandIDA & IBRD totalIDA blendIDA onlyIDA totalIndiaIndonesiaIran, Islamic Rep.IraqIrelandIsraelItalyJamaicaJapanJordanKazakhstanKenyaKorea, Rep.KosovoKuwaitKyrgyz RepublicLao PDRLate-demographic dividendLatin America & Caribbean Latin America & Caribbean (excluding high income)Latin America & the Caribbean (IDA & IBRD countries)LatviaLeast developed countries: UN classificationLebanonLiberiaLithuaniaLow & middle incomeLow incomeLower middle incomeLuxembourgMacao SAR, ChinaMacedonia, FYRMadagascarMalawiMalaysiaMaliMaltaMauritaniaMauritiusMexicoMiddle East & North AfricaMiddle East & North Africa (excluding high income)Middle East & North Africa (IDA & IBRD countries)Middle incomeMoldovaMongoliaMontenegroMoroccoMozambiqueNamibiaNepalNetherlandsNew ZealandNicaraguaNigerNigeriaNorth AmericaNorwayOECD membersOmanOther small statesPakistanPanamaParaguayPeruPhilippinesPolandPortugalPost-demographic dividendPre-demographic dividendPuerto RicoQatarRomaniaRussian FederationRwandaSaudi ArabiaSenegalSerbiaSeychellesSierra LeoneSingaporeSlovak RepublicSloveniaSmall statesSouth AfricaSouth AsiaSouth Asia (IDA & IBRD)South SudanSpainSri LankaSt. Kitts and NevisSt. LuciaSt. Vincent and the GrenadinesSub-Saharan Africa Sub-Saharan Africa (excluding high income)Sub-Saharan Africa (IDA & IBRD countries)SudanSurinameSwazilandSwedenSwitzerlandTajikistanTanzaniaThailandTimor-LesteTogoTongaTrinidad and TobagoTunisiaTurkeyTurkmenistanUgandaUkraineUnited Arab EmiratesUnited KingdomUnited StatesUpper middle incomeUruguayUzbekistanVanuatuVenezuela, RBVietnamWest Bank and GazaWorldYemen, Rep.ZambiaZimbabwe Zeitlinie:
Diese Zeitleiste vorliegt die Graphik ab 1961 J. bis 2016 J. Latin America & Caribbean . Die Angaben bis 1960 J. sind nicht vorhanden. Die Zahl aktueller Beobachtungen nach Daten: 56.
Die Quelle (Bezeichnung):
Kennzahlen der Weltentwicklung
Die Quelle (Einrichtung):
World Bank national accounts data, and OECD National Accounts data files.
Kategorien:
Economy & Growth
Es wurde aktualisiert:
23 Apr 2017 Jahr
Kennzahlen der Wertänderungen vom Jahr zum Jahr
im Durchschnitt:
2.273 Trln
Minimum:
614.47 Mlrd.
1 Jan 1961 Jahr
Maximum:
4.7 Trln
1 Jan 2015 Jahr
Zum Datum der Beobachtung
Wert
Absolute Veränderung
Die Veränderung bezüglich dem vorherigen Wert
1 Jan 1961 Jahr
614.47 Mlrd.
+614.47 Mlrd.
0.0%
1 Jan 1962 Jahr
658.253 Mlrd.
+43.782 Mlrd.
7.13%
1 Jan 1963 Jahr
688.091 Mlrd.
+29.839 Mlrd.
4.53%
1 Jan 1964 Jahr
707.105 Mlrd.
+19.013 Mlrd.
2.76%
1 Jan 1965 Jahr
752.217 Mlrd.
+45.113 Mlrd.
6.38%
1 Jan 1966 Jahr
769.475 Mlrd.
+17.258 Mlrd.
2.29%
1 Jan 1967 Jahr
808.47 Mlrd.
+38.995 Mlrd.
5.07%
1 Jan 1968 Jahr
854.151 Mlrd.
+45.681 Mlrd.
5.65%
1 Jan 1969 Jahr
911.646 Mlrd.
+57.495 Mlrd.
6.73%
1 Jan 1970 Jahr
968.43 Mlrd.
+56.784 Mlrd.
6.23%
1 Jan 1971 Jahr
1.041 Trln
+72.679 Mlrd.
7.5%
1 Jan 1972 Jahr
1.127 Trln
+85.495 Mlrd.
8.21%
1 Jan 1973 Jahr
1.215 Trln
+88.375 Mlrd.
7.84%
1 Jan 1974 Jahr
1.315 Trln
+100.467 Mlrd.
8.27%
1 Jan 1975 Jahr
1.357 Trln
+41.912 Mlrd.
3.19%
1 Jan 1976 Jahr
1.404 Trln
+46.66 Mlrd.
3.44%
1 Jan 1977 Jahr
1.505 Trln
+101.385 Mlrd.
7.22%
1 Jan 1978 Jahr
1.579 Trln
+73.215 Mlrd.
4.86%
1 Jan 1979 Jahr
1.631 Trln
+51.961 Mlrd.
3.29%
1 Jan 1980 Jahr
1.744 Trln
+113.609 Mlrd.
6.97%
1 Jan 1981 Jahr
1.874 Trln
+129.446 Mlrd.
7.42%
1 Jan 1982 Jahr
1.871 Trln
-2.33 Mlrd.
-0.12%
1 Jan 1983 Jahr
1.884 Trln
+12.352 Mlrd.
0.66%
1 Jan 1984 Jahr
1.864 Trln
-19.409 Mlrd.
-1.03%
1 Jan 1985 Jahr
1.935 Trln
+70.681 Mlrd.
3.79%
1 Jan 1986 Jahr
1.971 Trln
+36.352 Mlrd.
1.88%
1 Jan 1987 Jahr
2.093 Trln
+121.936 Mlrd.
6.19%
1 Jan 1988 Jahr
2.118 Trln
+24.803 Mlrd.
1.18%
1 Jan 1989 Jahr
2.11 Trln
-8.229 Mlrd.
-0.39%
1 Jan 1990 Jahr
2.135 Trln
+24.833 Mlrd.
1.18%
1 Jan 1991 Jahr
2.19 Trln
+55.7 Mlrd.
2.61%
1 Jan 1992 Jahr
2.249 Trln
+58.652 Mlrd.
2.68%
1 Jan 1993 Jahr
2.322 Trln
+72.898 Mlrd.
3.24%
1 Jan 1994 Jahr
2.409 Trln
+87.224 Mlrd.
3.76%
1 Jan 1995 Jahr
2.505 Trln
+96.077 Mlrd.
3.99%
1 Jan 1996 Jahr
2.544 Trln
+39.165 Mlrd.
1.56%
1 Jan 1997 Jahr
2.638 Trln
+93.592 Mlrd.
3.68%
1 Jan 1998 Jahr
2.778 Trln
+139.888 Mlrd.
5.3%
1 Jan 1999 Jahr
2.832 Trln
+54.265 Mlrd.
1.95%
1 Jan 2000 Jahr
2.834 Trln
+1.517 Mlrd.
0.05%
1 Jan 2001 Jahr
2.943 Trln
+109.807 Mlrd.
3.88%
1 Jan 2002 Jahr
2.987 Trln
+44.042 Mlrd.
1.5%
1 Jan 2003 Jahr
2.963 Trln
-24.359 Mlrd.
-0.82%
1 Jan 2004 Jahr
3.018 Trln
+54.797 Mlrd.
1.85%
1 Jan 2005 Jahr
3.171 Trln
+152.68 Mlrd.
5.06%
1 Jan 2006 Jahr
3.317 Trln
+146.157 Mlrd.
4.61%
1 Jan 2007 Jahr
3.511 Trln
+194.742 Mlrd.
5.87%
1 Jan 2008 Jahr
3.746 Trln
+234.24 Mlrd.
6.67%
1 Jan 2009 Jahr
3.928 Trln
+181.853 Mlrd.
4.85%
1 Jan 2010 Jahr
3.889 Trln
-38.39 Mlrd.
-0.98%
1 Jan 2011 Jahr
4.161 Trln
+271.917 Mlrd.
6.99%
1 Jan 2012 Jahr
4.357 Trln
+196.282 Mlrd.
4.72%
1 Jan 2013 Jahr
4.492 Trln
+135.105 Mlrd.
3.1%
1 Jan 2014 Jahr
4.651 Trln
+158.229 Mlrd.
3.52%
1 Jan 2015 Jahr
4.7 Trln
+49.759 Mlrd.
1.07%
1 Jan 2016 Jahr
4.649 Trln
-51.841 Mlrd.
-1.1%
Bewertung der Länder gemäß mit laufender Statistik nach Jahren


Kommentare: